Every Intuition Behind Fourier Transform

How Does Fourier Transform Decompose Signals?
This was the question that remained unclear to me even after watching many long videos and reading several blog posts. Even though I understood the math, I was not grasping the intuition behind it. I wanted to answer this question: “Why is this formula related to decomposing signals?”
So, let’s delve into the intuition! (Consider yourself lucky – you won’t have to watch as many videos or read as many blogs as I did.)
Fourier Transform can decompose a complex wave into its basic sine components.
Every wave can be expressed via a combination of some basic sine waves.
Why is this useful? Here is a common scenario: you recorded a song, but an unwanted high pitch occurred during the recording. If we can decompose the signals, we may be able to detect this high pitch and nullify it by introducing a negative wave. This is just one example among many.
Ultimately, when given two different waves, we want to be able to answer: is one of these waves a part of the other wave?
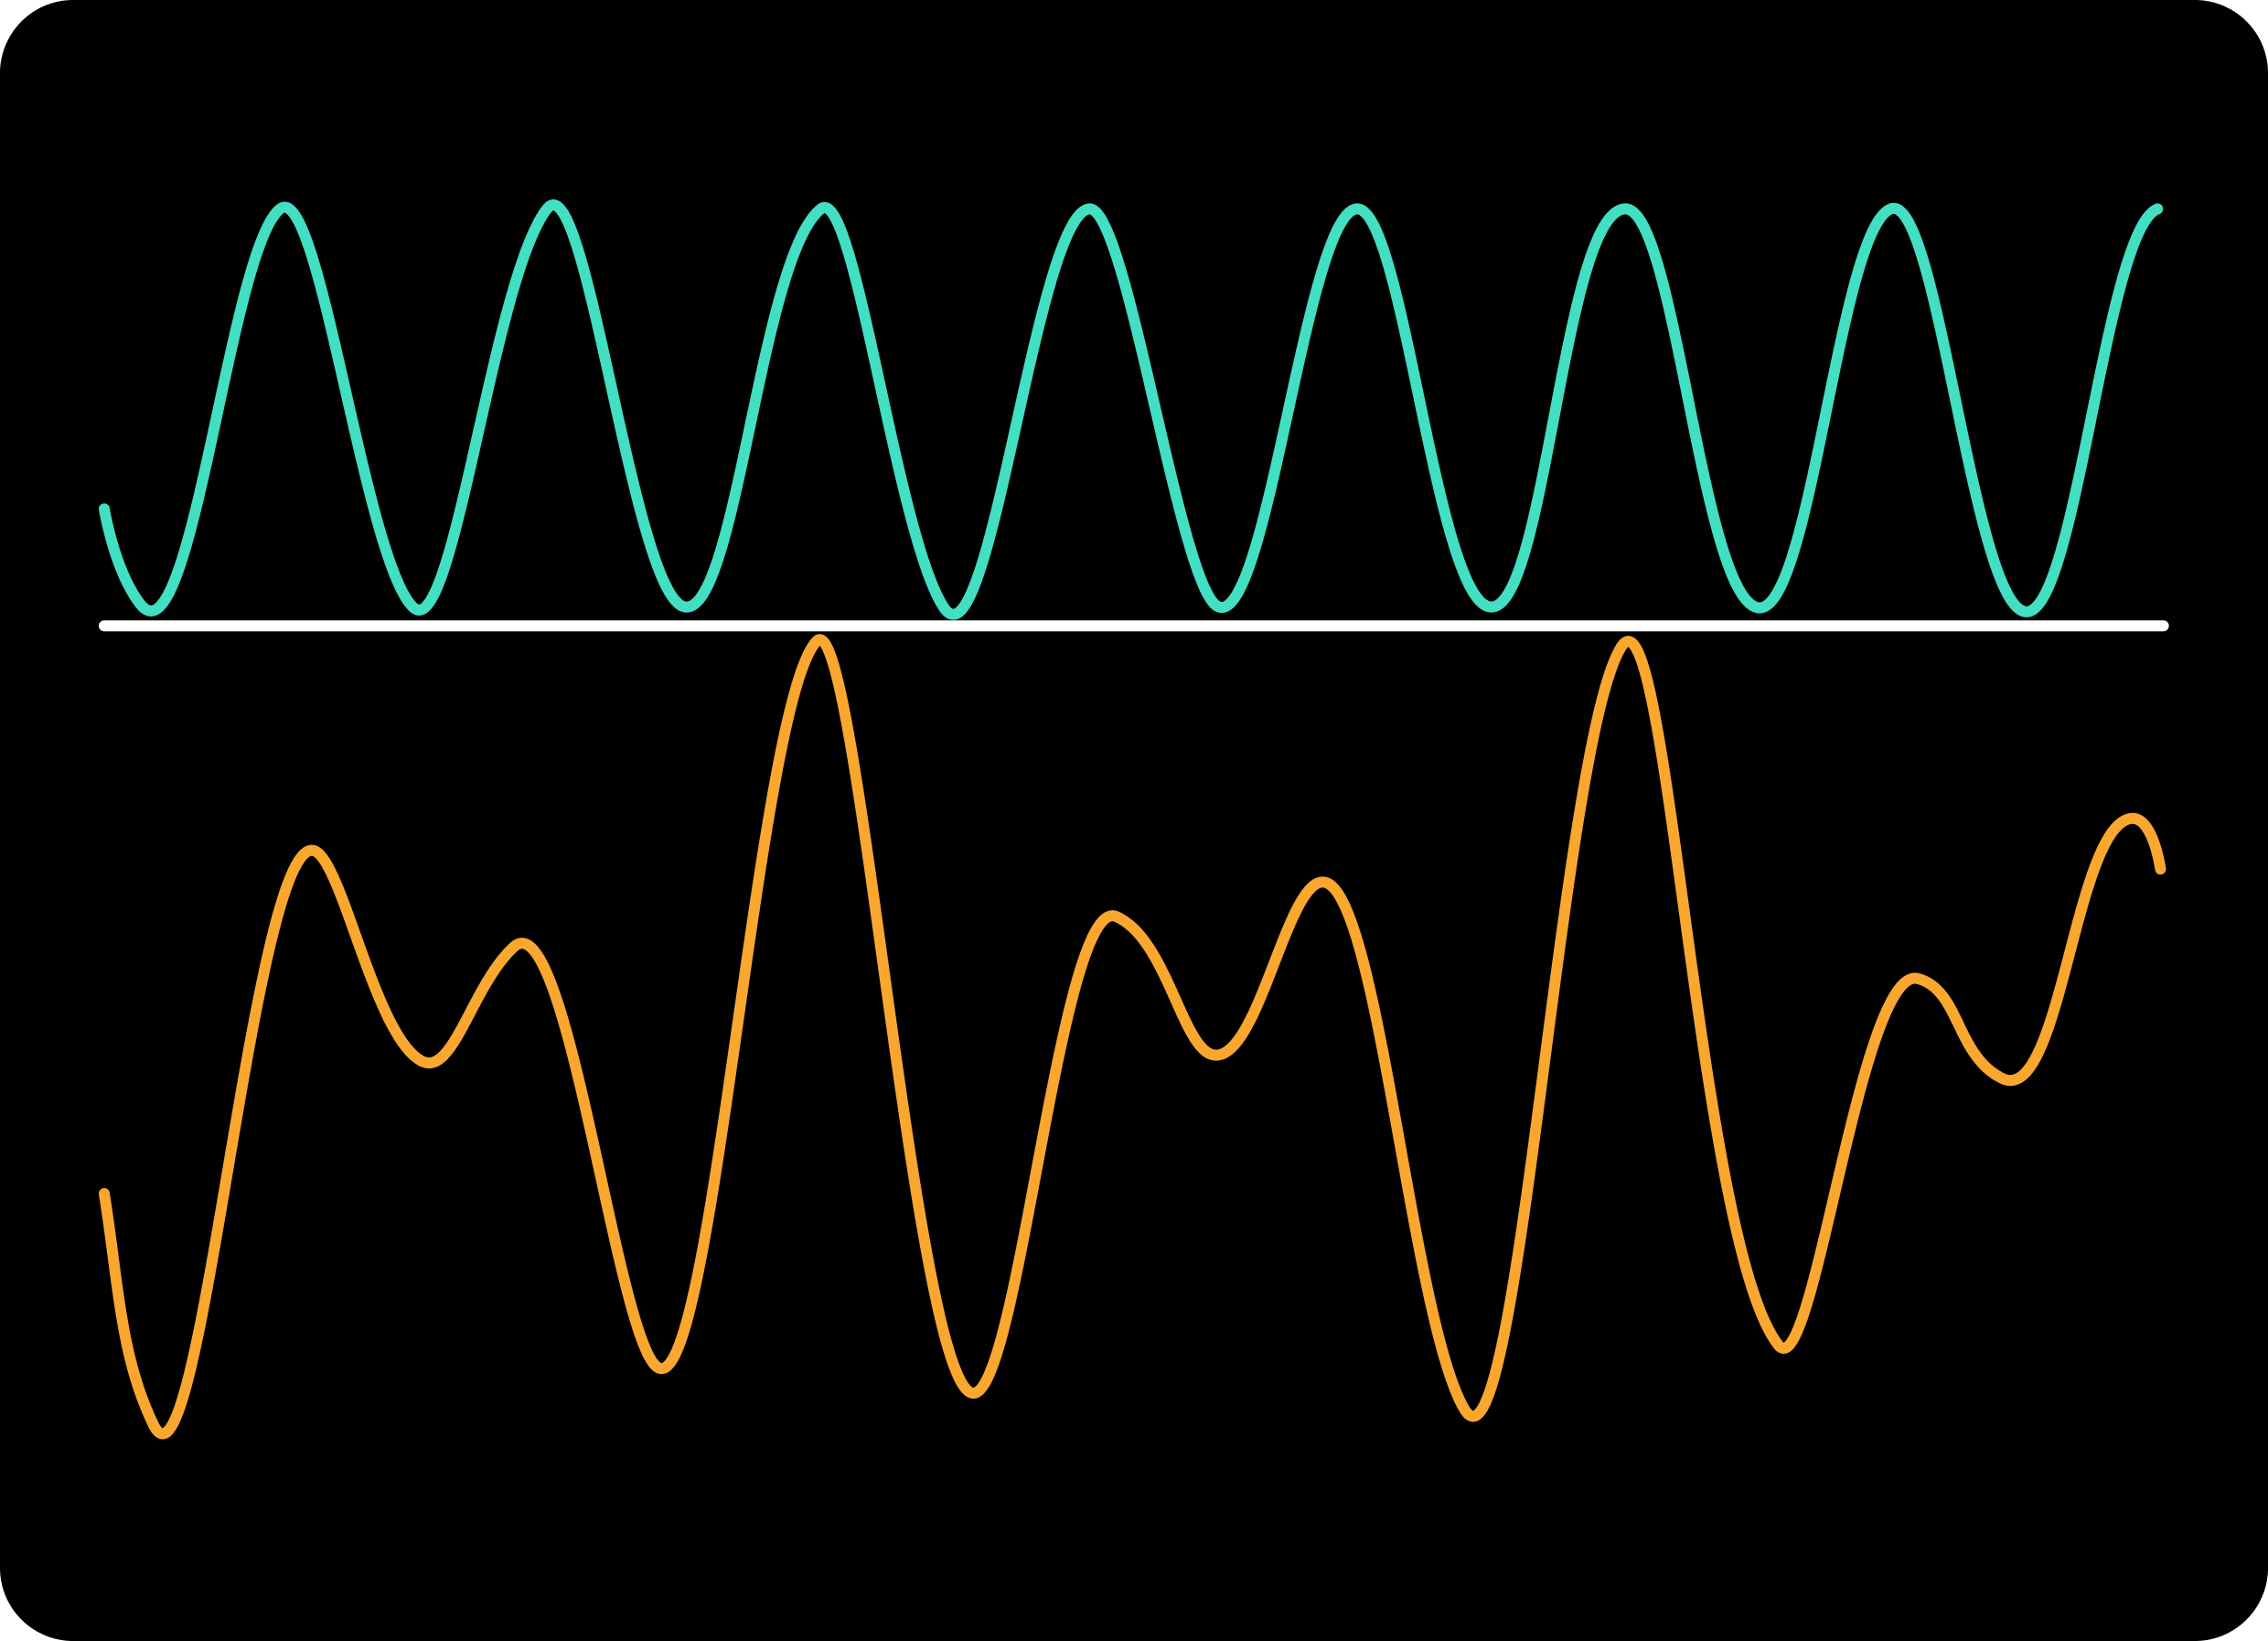
For example, in the above, the cyan one is a basic sine wave, whereas the orange one is a complex wave (an addition of some basic sine waves). We don’t know yet whether the cyan wave is a part of the orange wave.
What does being a part of the orange wave mean here? Recall:
Every wave can be expressed via a combination of some basic sine waves.
So, the orange wave can be expressed as a sum of some basic sine waves. If the cyan wave is one of these basic sine waves that we got from decomposing the orange wave, then the cyan wave is indeed a part of the orange wave.
Now, how do we decompose the orange wave into its components?
It is a better idea to first observe how this complex wave is constructed by basic sine waves. Let’s start with adding two sine waves.
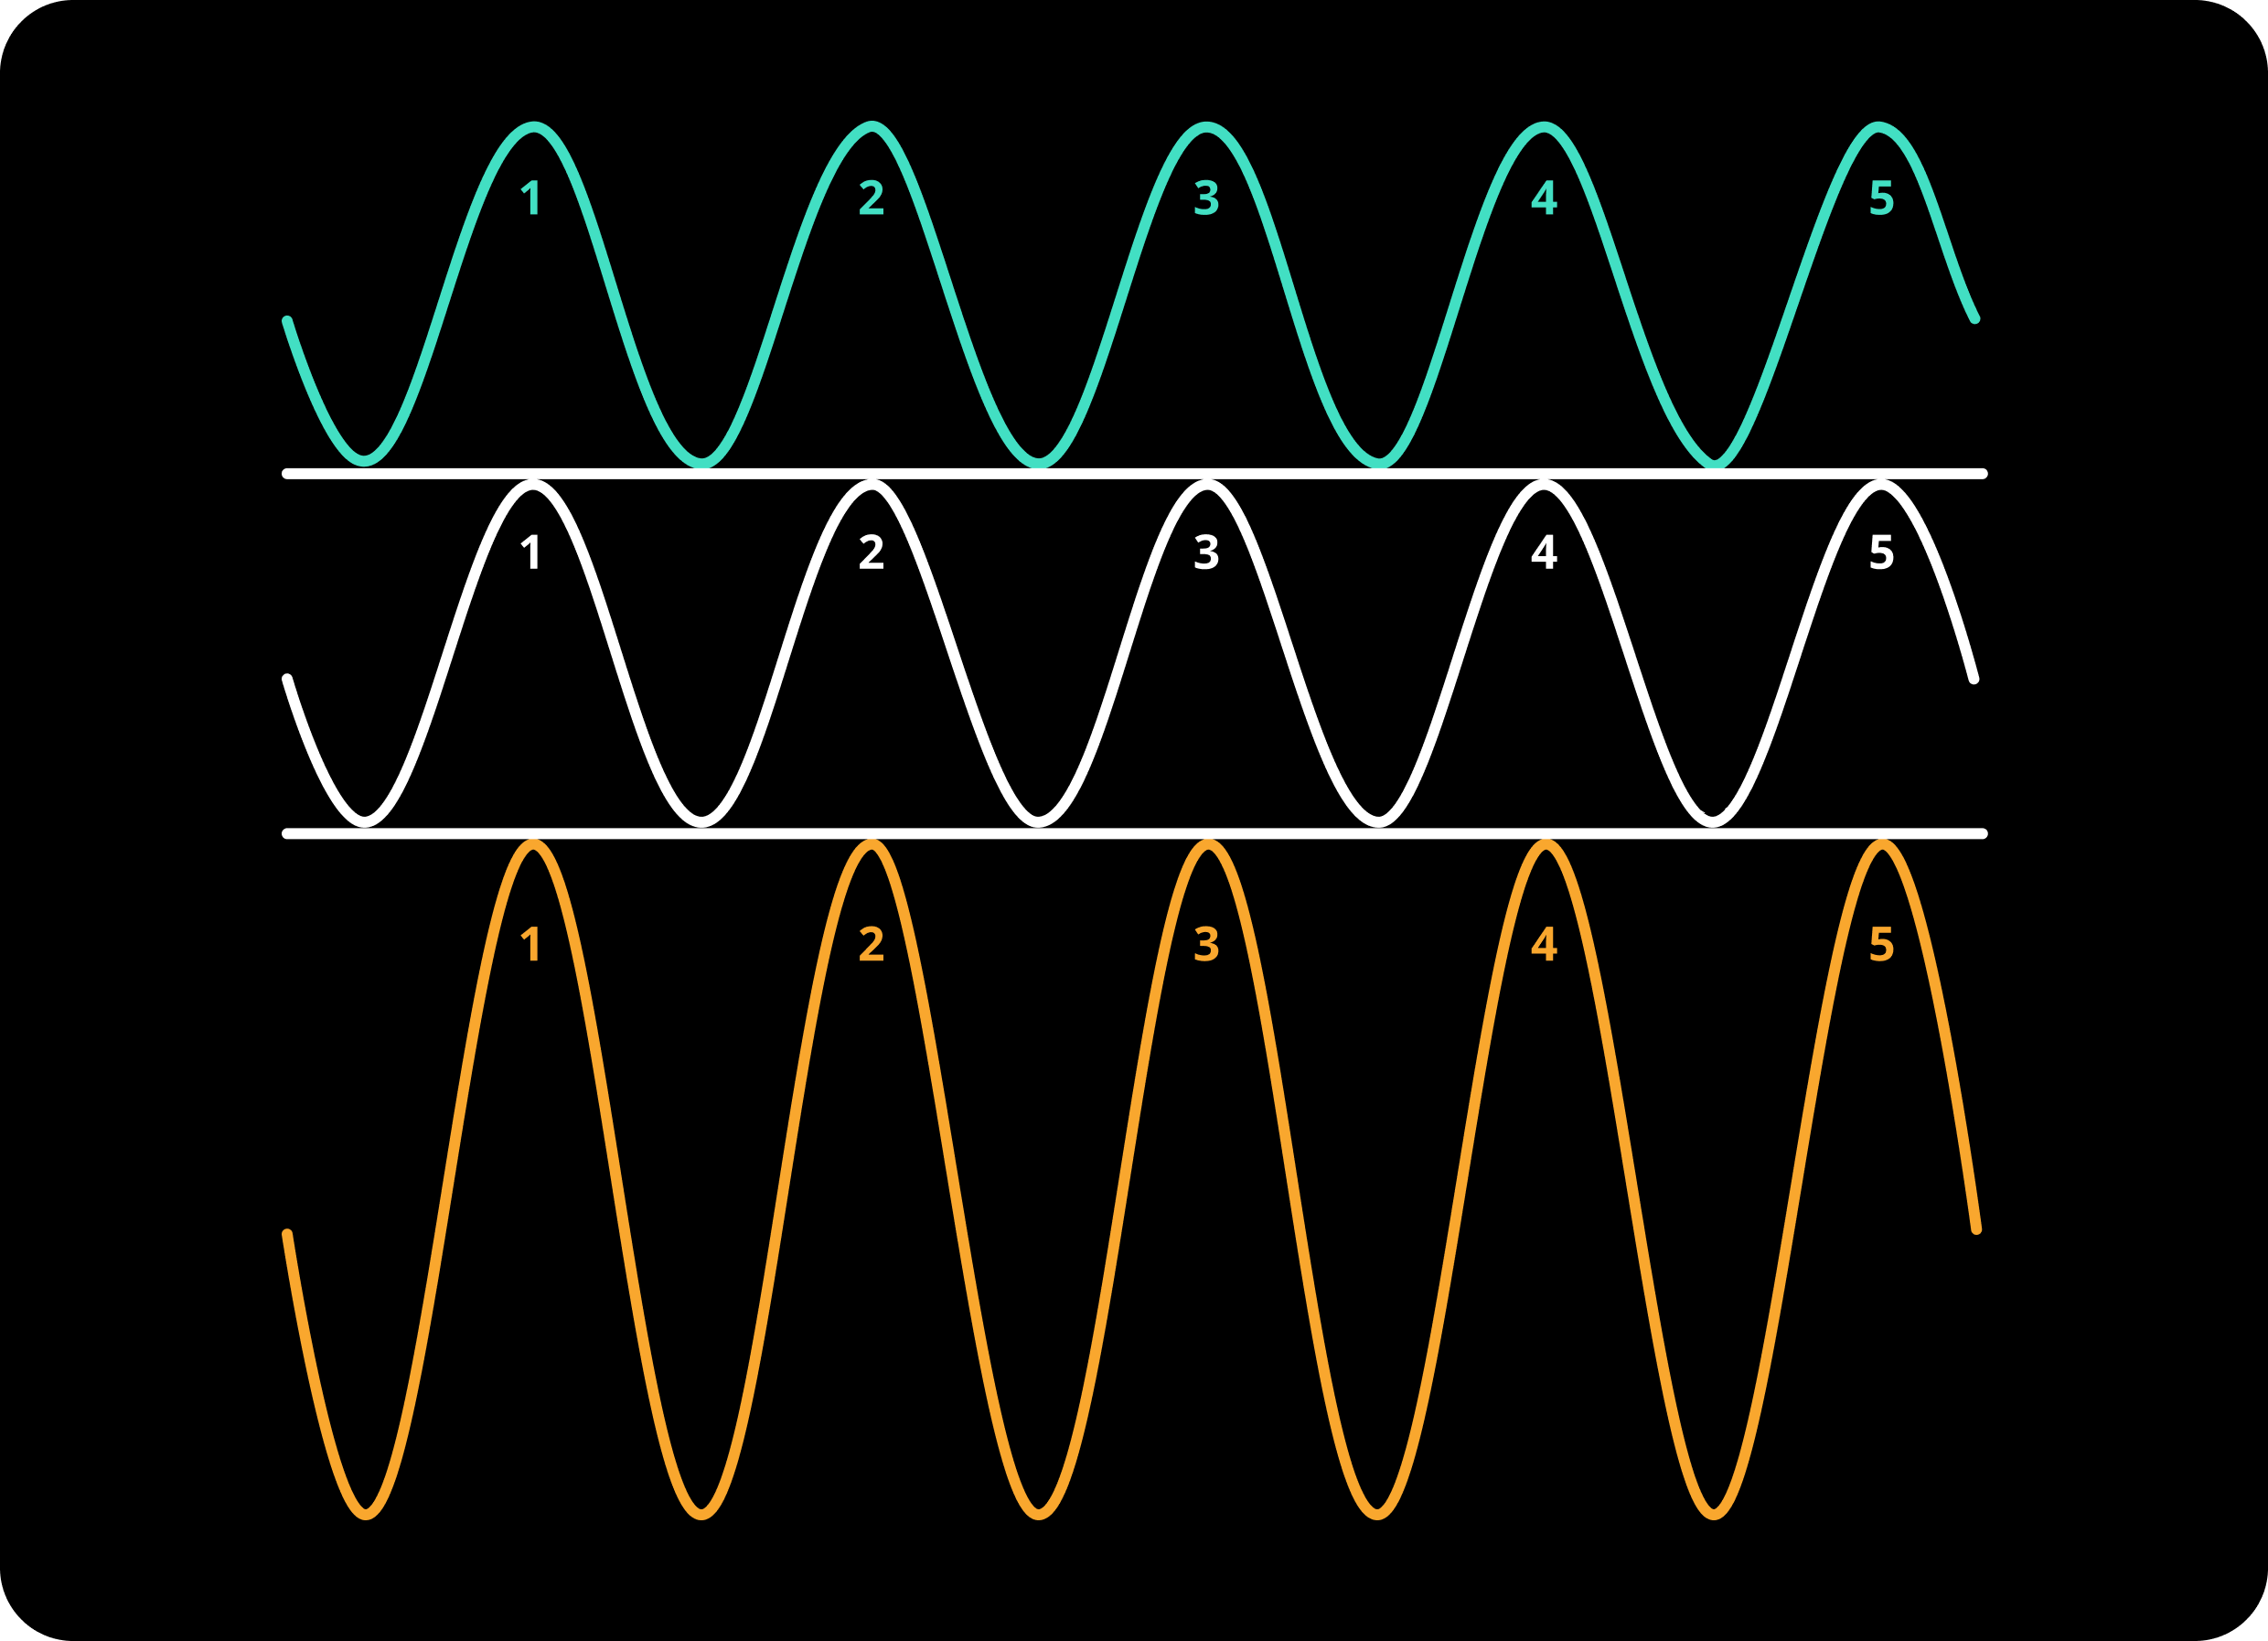 fig. 1
In the above image, we have 2 waves (cyan and white). They both have 5 high points and 5 low points (I only denoted the high points with numbers in the image). For the sake of simplicity, let’s say their frequency is 5.
If we add these cyan and white waves, we get the orange wave. Since these cyan and white waves are exact copies of each other, the orange wave is not that different from them, as you can see. It is only 2 times stronger. It’s very much like we multiplied either white or the cyan one with 2 and got the orange wave.
It is like addition; if you think of the low points as negative values and the high points as positive values, we just added two high points together and two low points together, and got the orange wave.
It indeed makes sense, since all these waves can be represented by a function. For example, the above ones (cyan and white) can be interpreted as waves, and what we are doing to compute the orange wave is actually adding two functions together, .
OUTCOME: the peaks of the waves are preserved when added together.
Let’s move the white wave a bit.

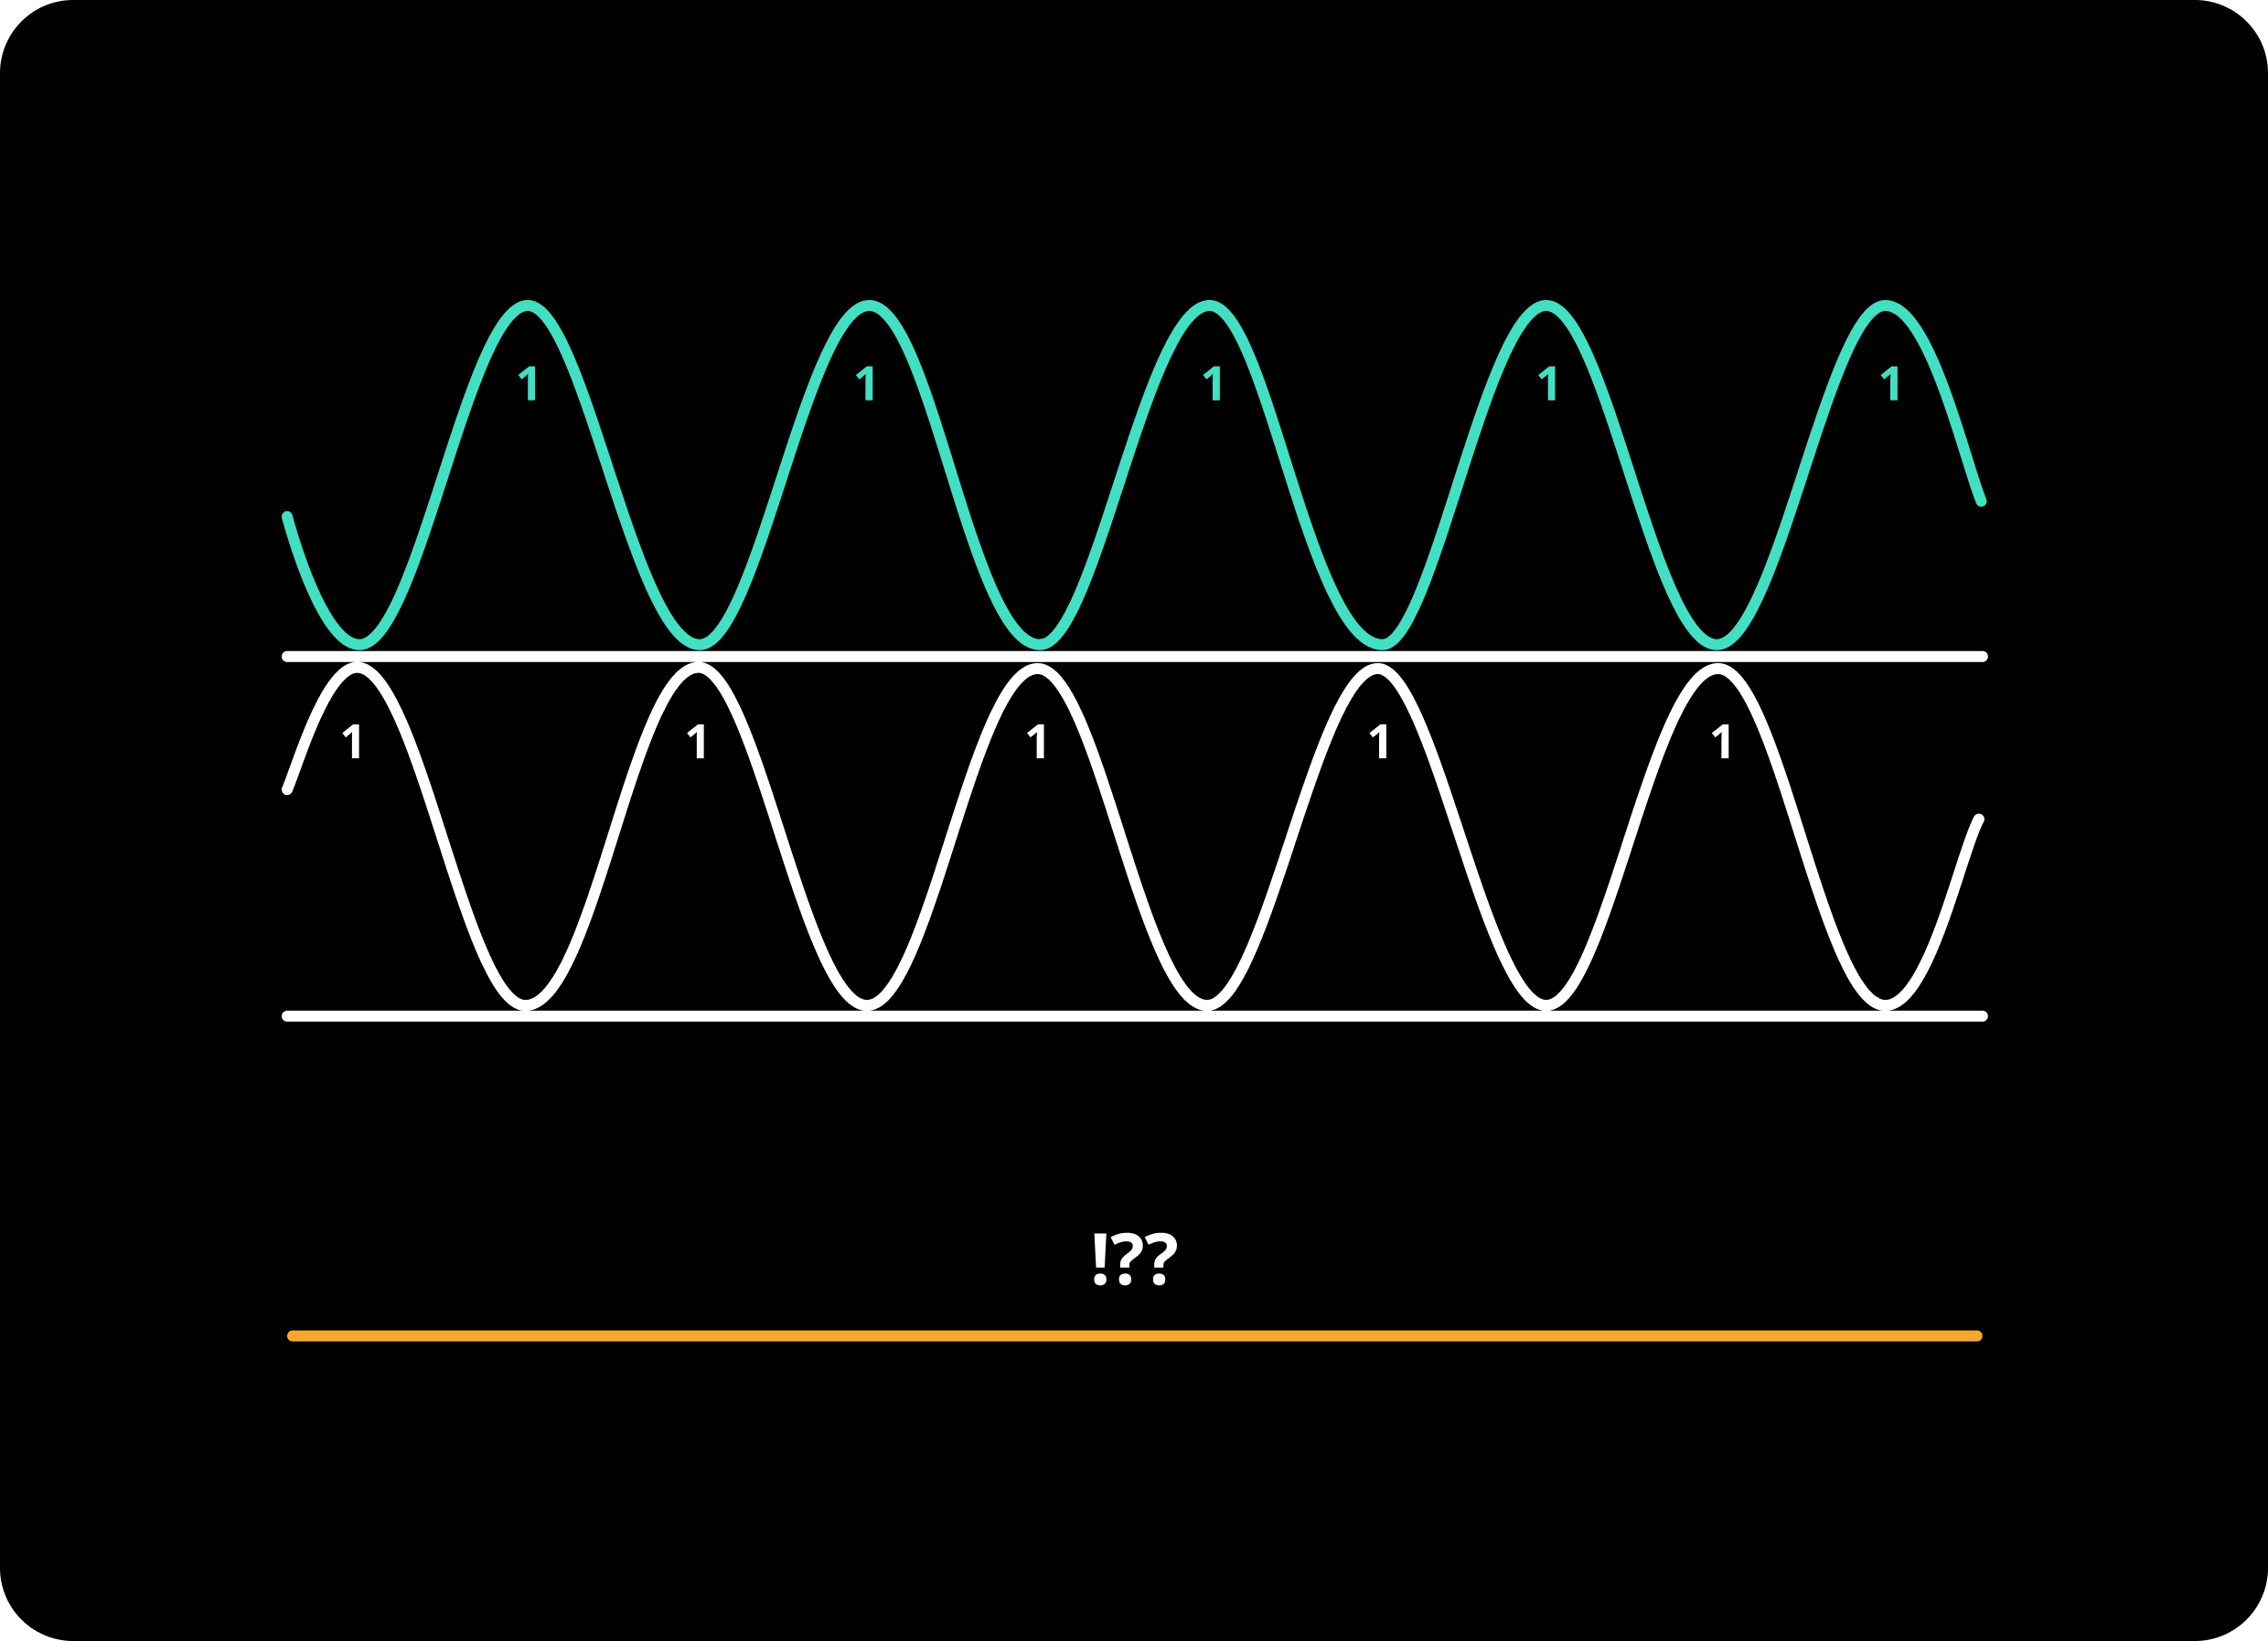 fig. 2
In this one, the cyan and the white waves are still exact copies of each other, with one slight difference: the white one is shifted a bit.
Previously, the high and low points of the waves were corresponding (peak points of the cyan one were also the high point of the white one). But now, the peak points of the cyan one are low points of the white one.
Again, it is like addition; we did add the high points of cyan (positive values) to the low points of the white (negative values), and they did cancel each other. We ended up getting the orange wave (which is 0 in this analogy).
OUTCOME: the peaks of the waves are still preserved when added together. However, since they were the exact opposites, we got 0.
Now, what will happen if the waves are not copies of each other?

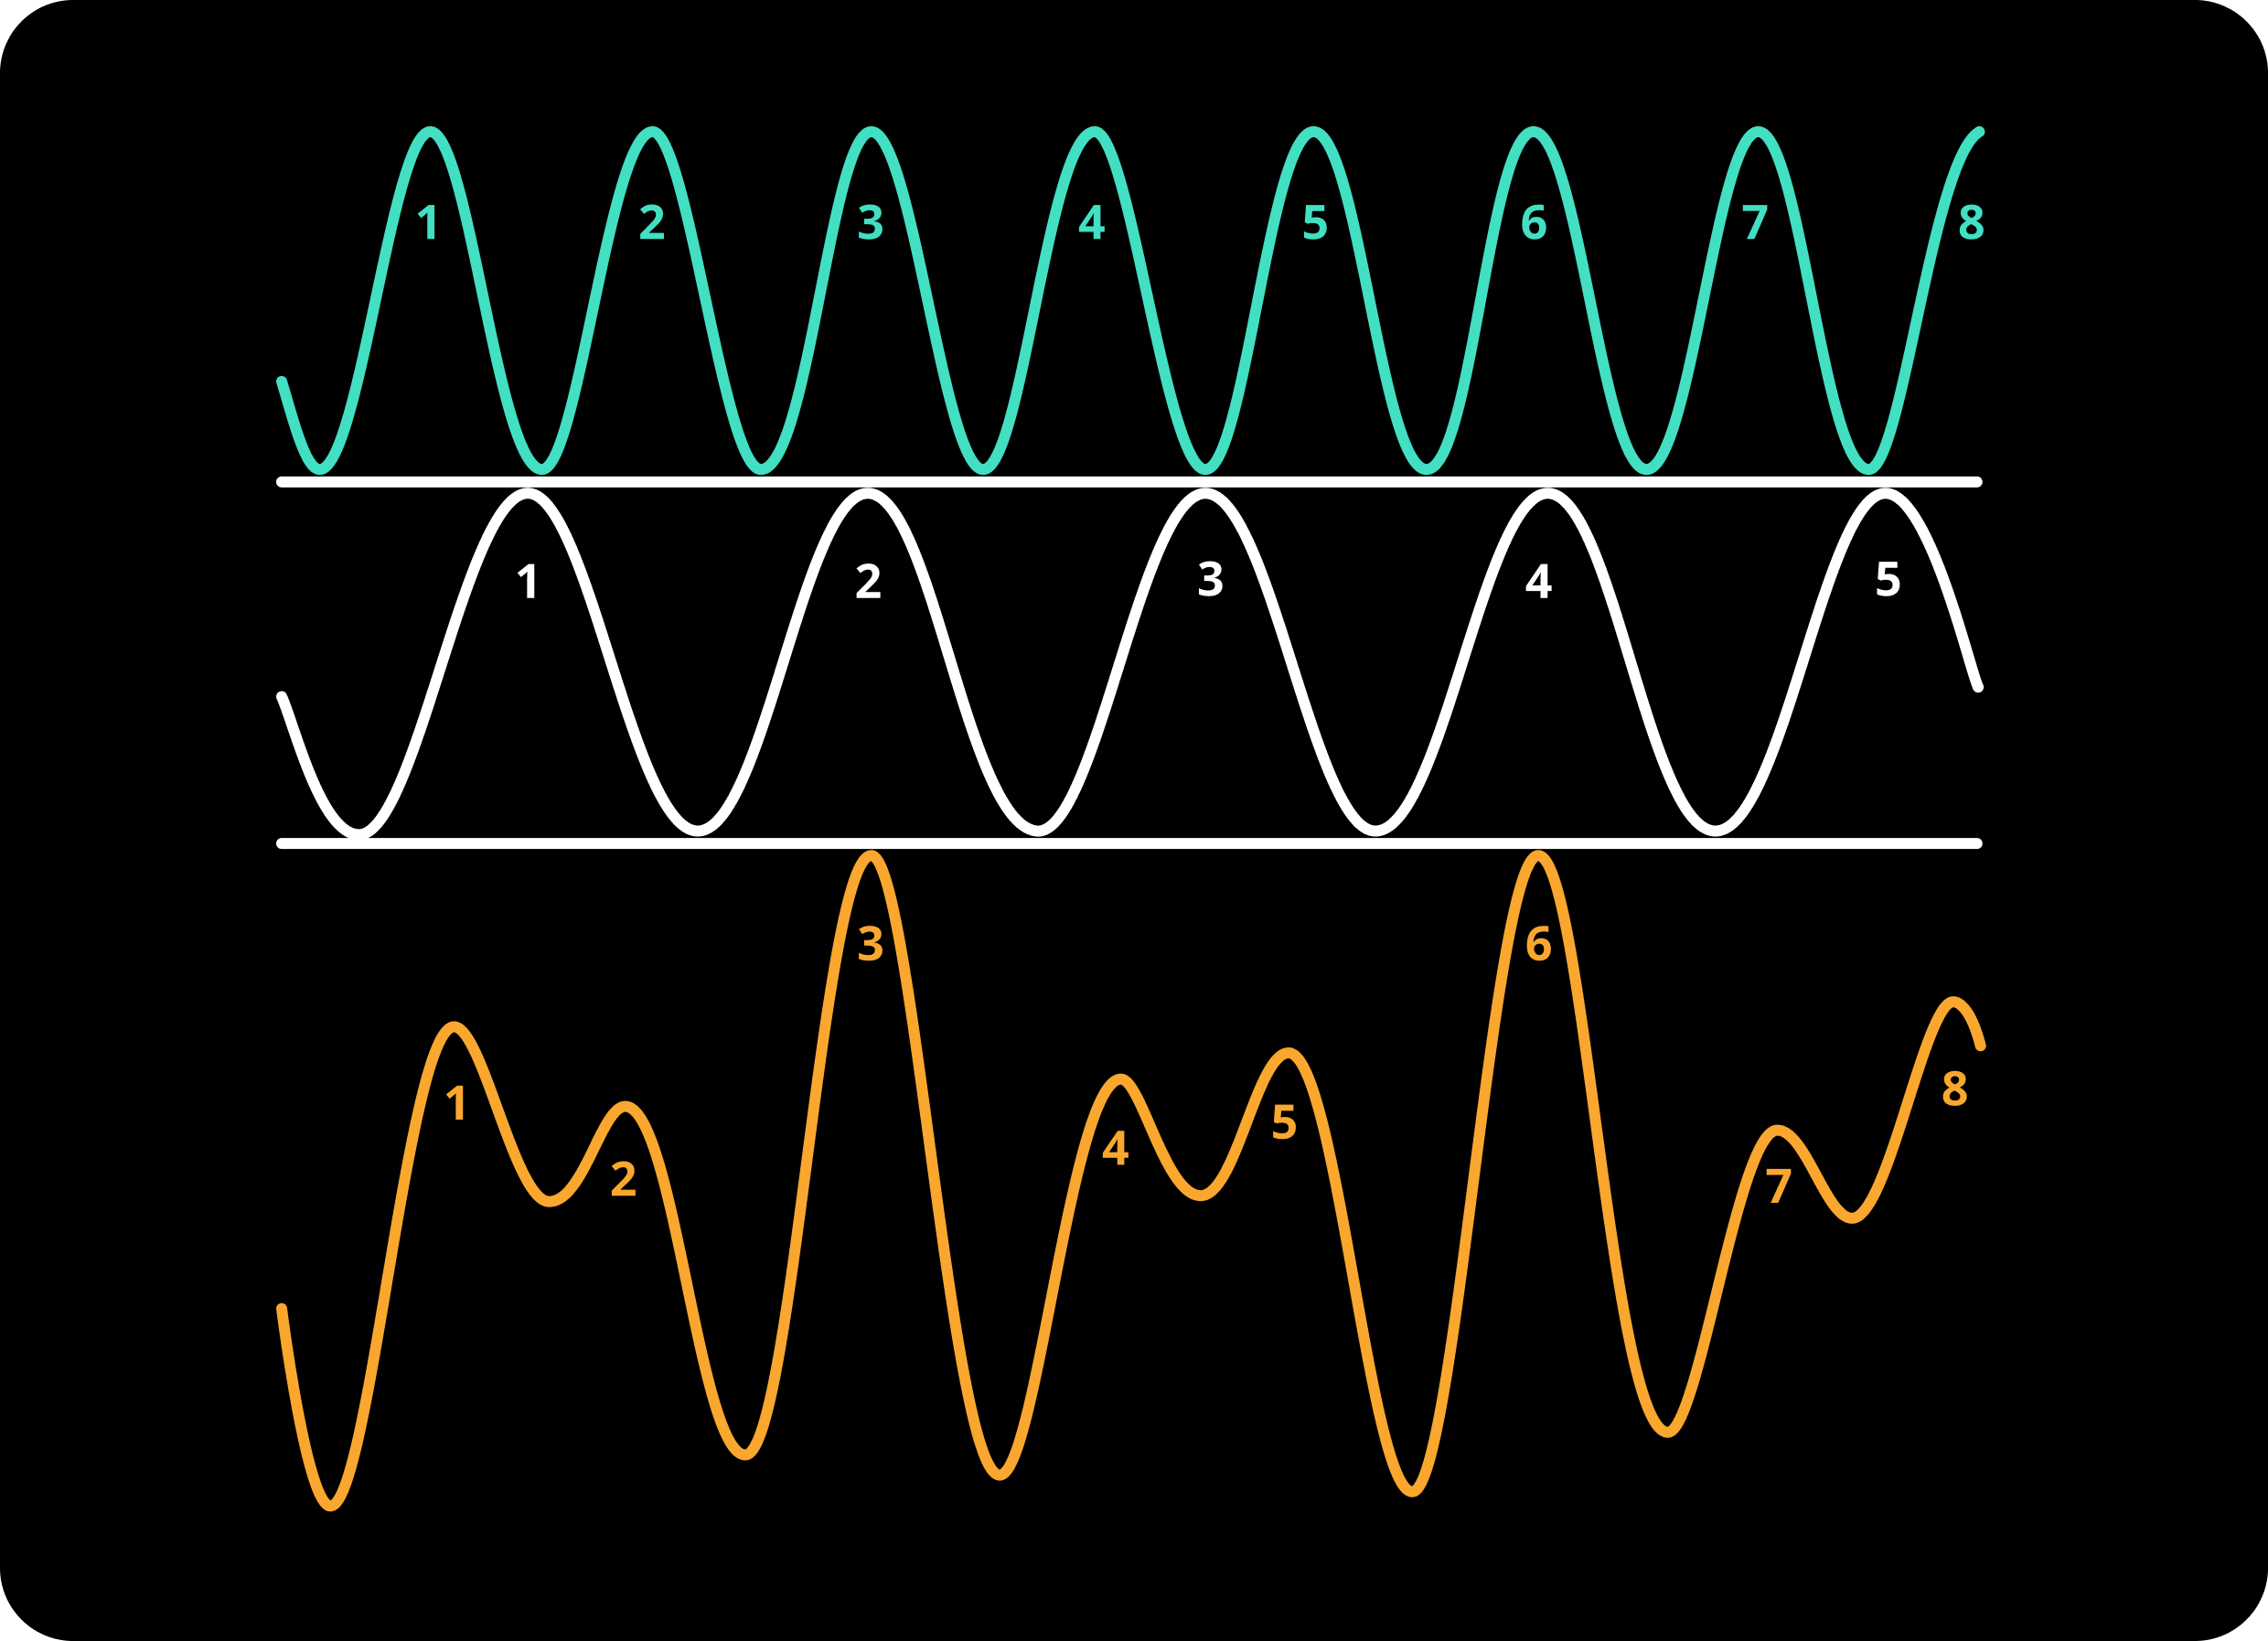 fig. 3
This may look very ugly and chaotic at first glance. Let’s try to inspect it more.
Highlighting the high points of the cyan wave and seeing how they correspond to the orange wave:

Now, for the white wave:
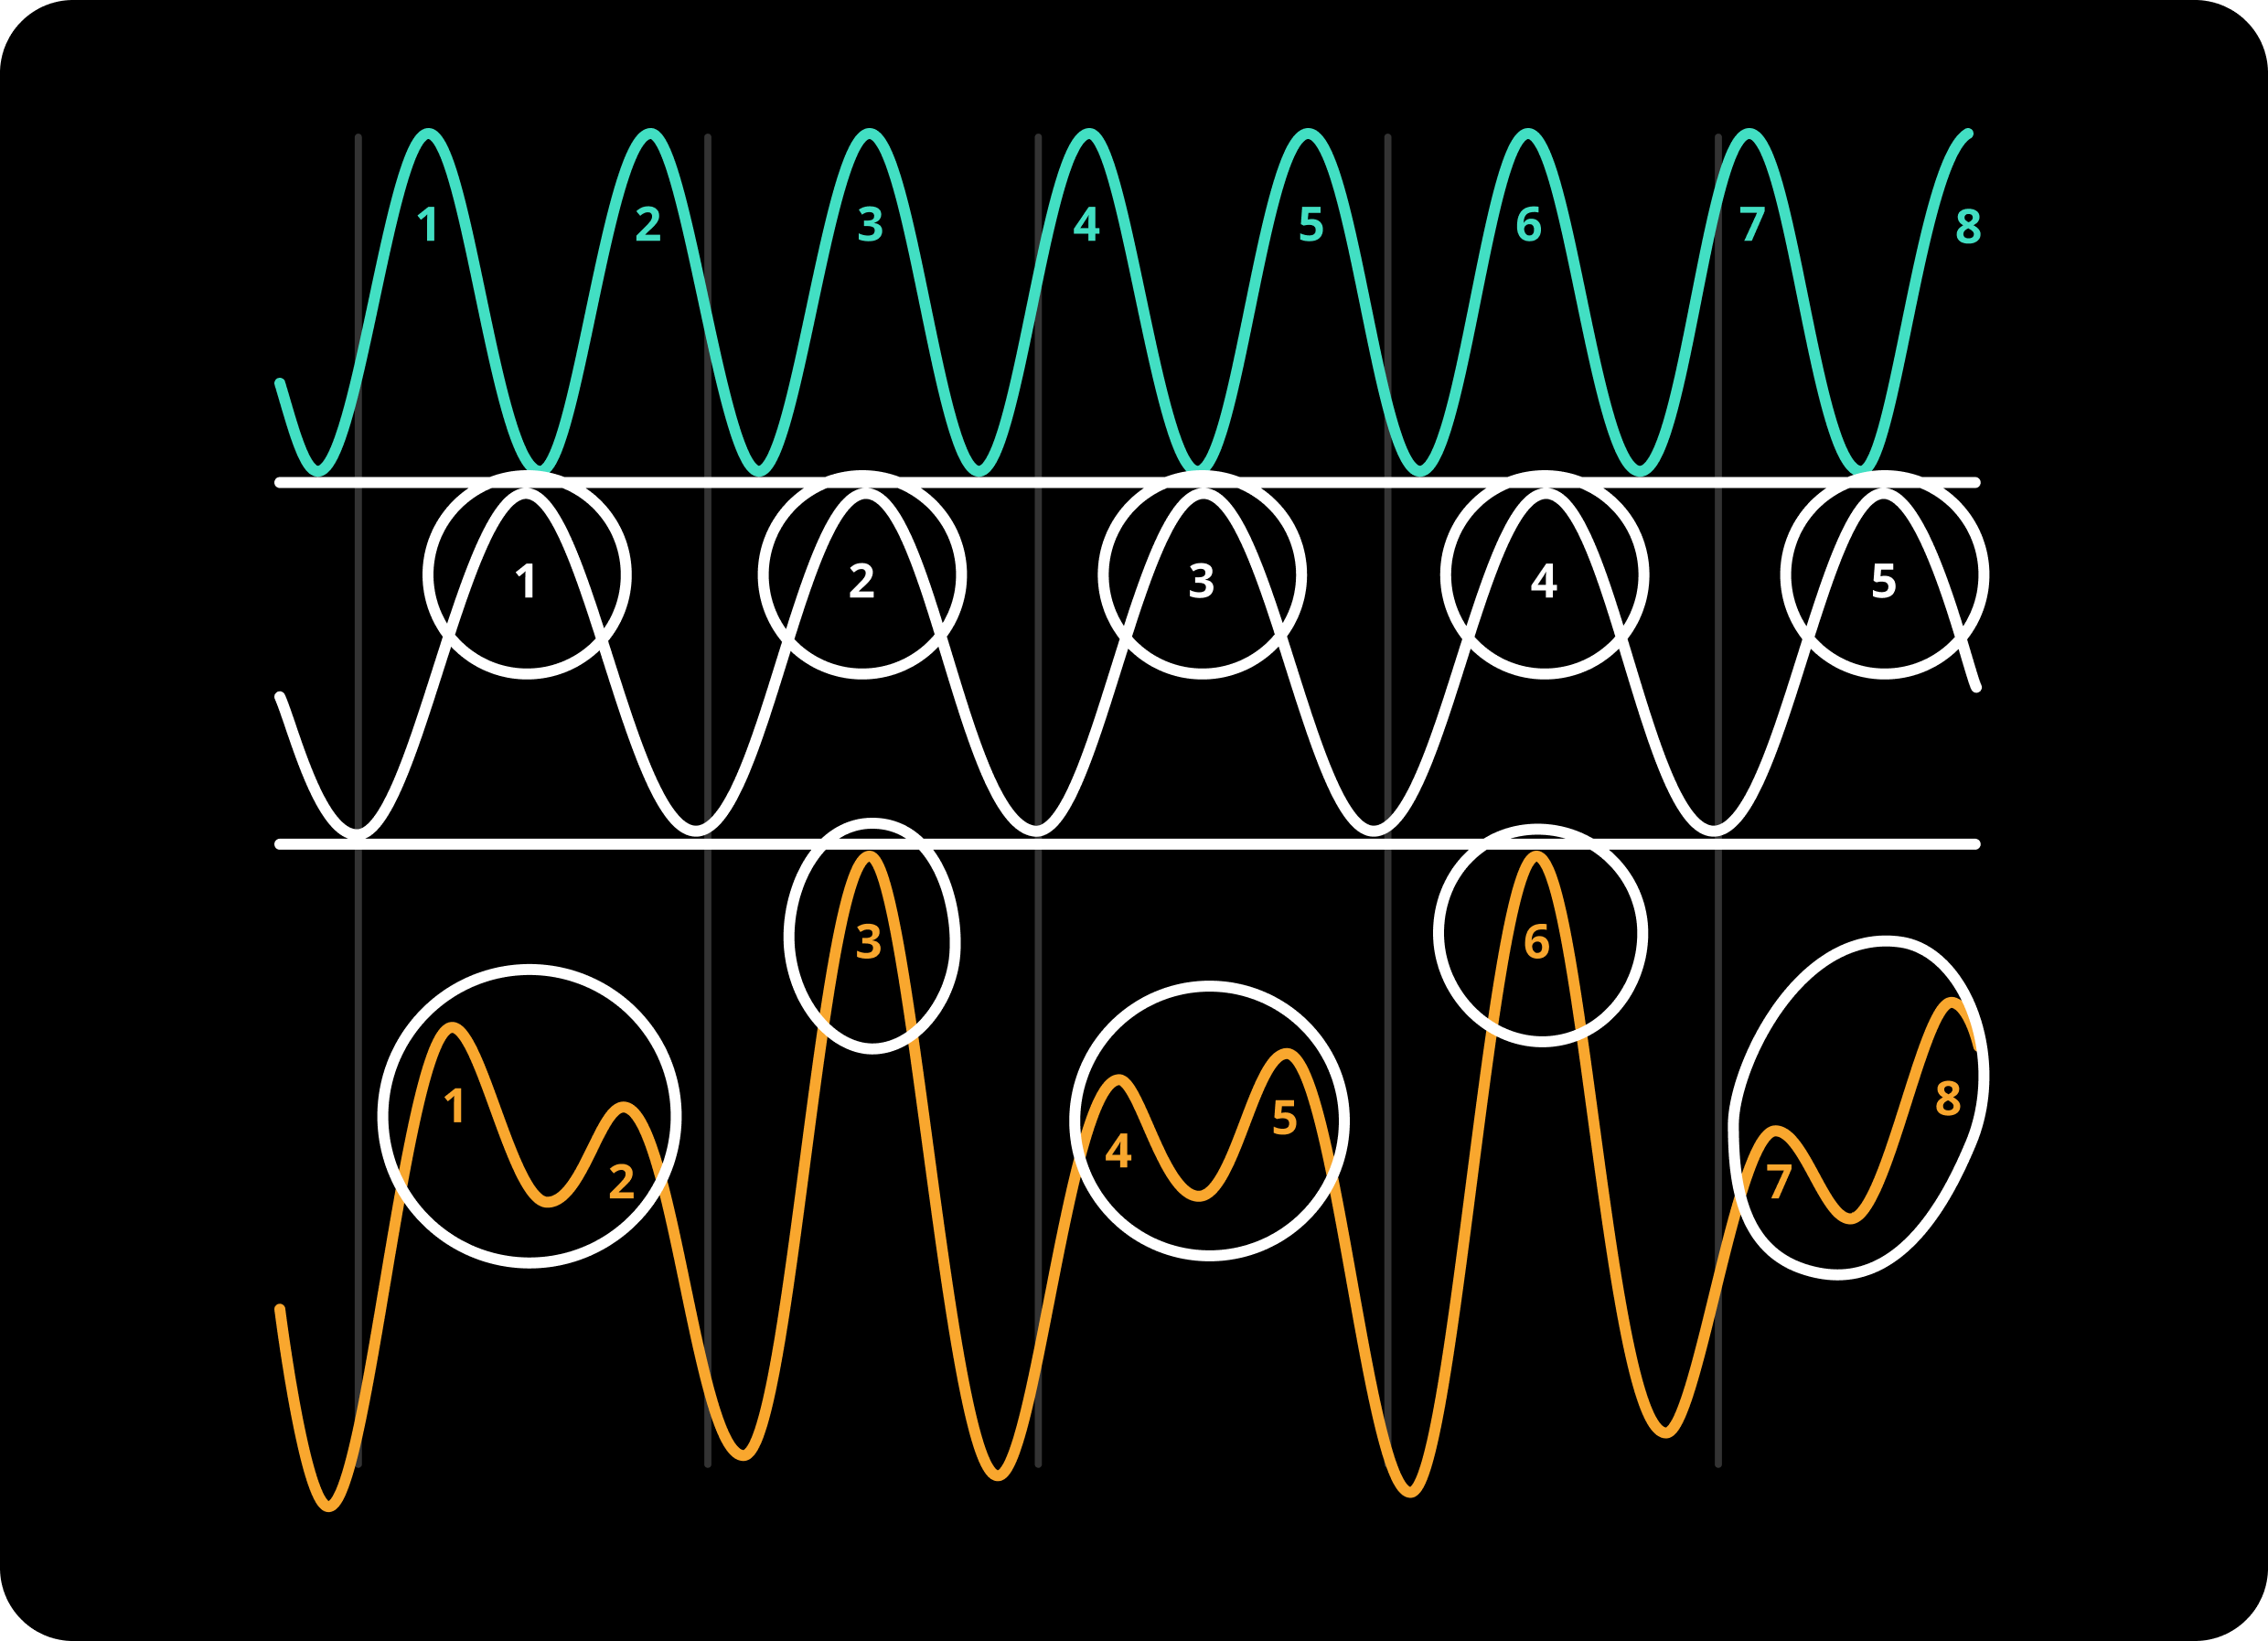
This is showing us a great property of adding waves! If we are adding waves that have different frequencies, their frequencies will be observable in the resulting wave.
OUTCOME: Even though we added waves from different frequencies, the peaks of the waves are preserved when added together!
For generating images similar to the above ones: Wave Generator
I believe we now have a good understanding of how we add two basic waves together and compose a complex wave. It’s time to summarize what we have learned and proceed into decomposing a wave.
First, let’s rehearse what Fourier transform was doing:
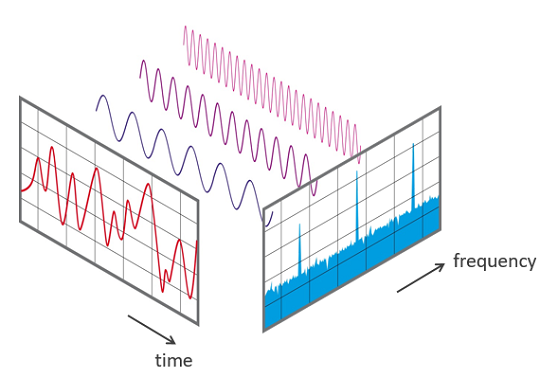 image taken from: NTi Audio
This is a great image that summarizes the process of Fourier Transform.
time domain, which is the most common and normal representation).There is also inverse Fourier Transform, which converts frequency domain to time domain (does the exact opposite of what Fourier Transform does, as you expected).
Let’s overview what we have learned from the first 2 images (fig. 1 and fig. 2):
fig. 1). We can’t extract the cyan and white from the orange one in this case just by looking at the orange wave (6 could be both 4+2 or 3+3).fig. 2). We have again no way of extracting the components of the resulting wave in this case (0 could be -2+2, or it could be -74+74, who knows).Finally, let’s overview what we have learned from fig. 3 (different frequency ones):
orange wave, we can tell what might be the components. With respect to our sensitivity/precision for high points, we may say that the orange wave’s frequency is 8, or it is 5. And both are correct. The orange wave is the sum of two waves; the frequency of one of them is 5, and the other one is 8.This is all we need actually because what Fourier Transform promises is: it can tell how many different frequencies are in a wave.
We should find a way to do this mathematically so that our beloved humans won’t have to stare at weird waves for hours. Instead, our computers can solve these for us.
Here is another take on fig. 3 (adding together 5 and 8 frequency waves), but this time the waves are placed on a coordinate system:
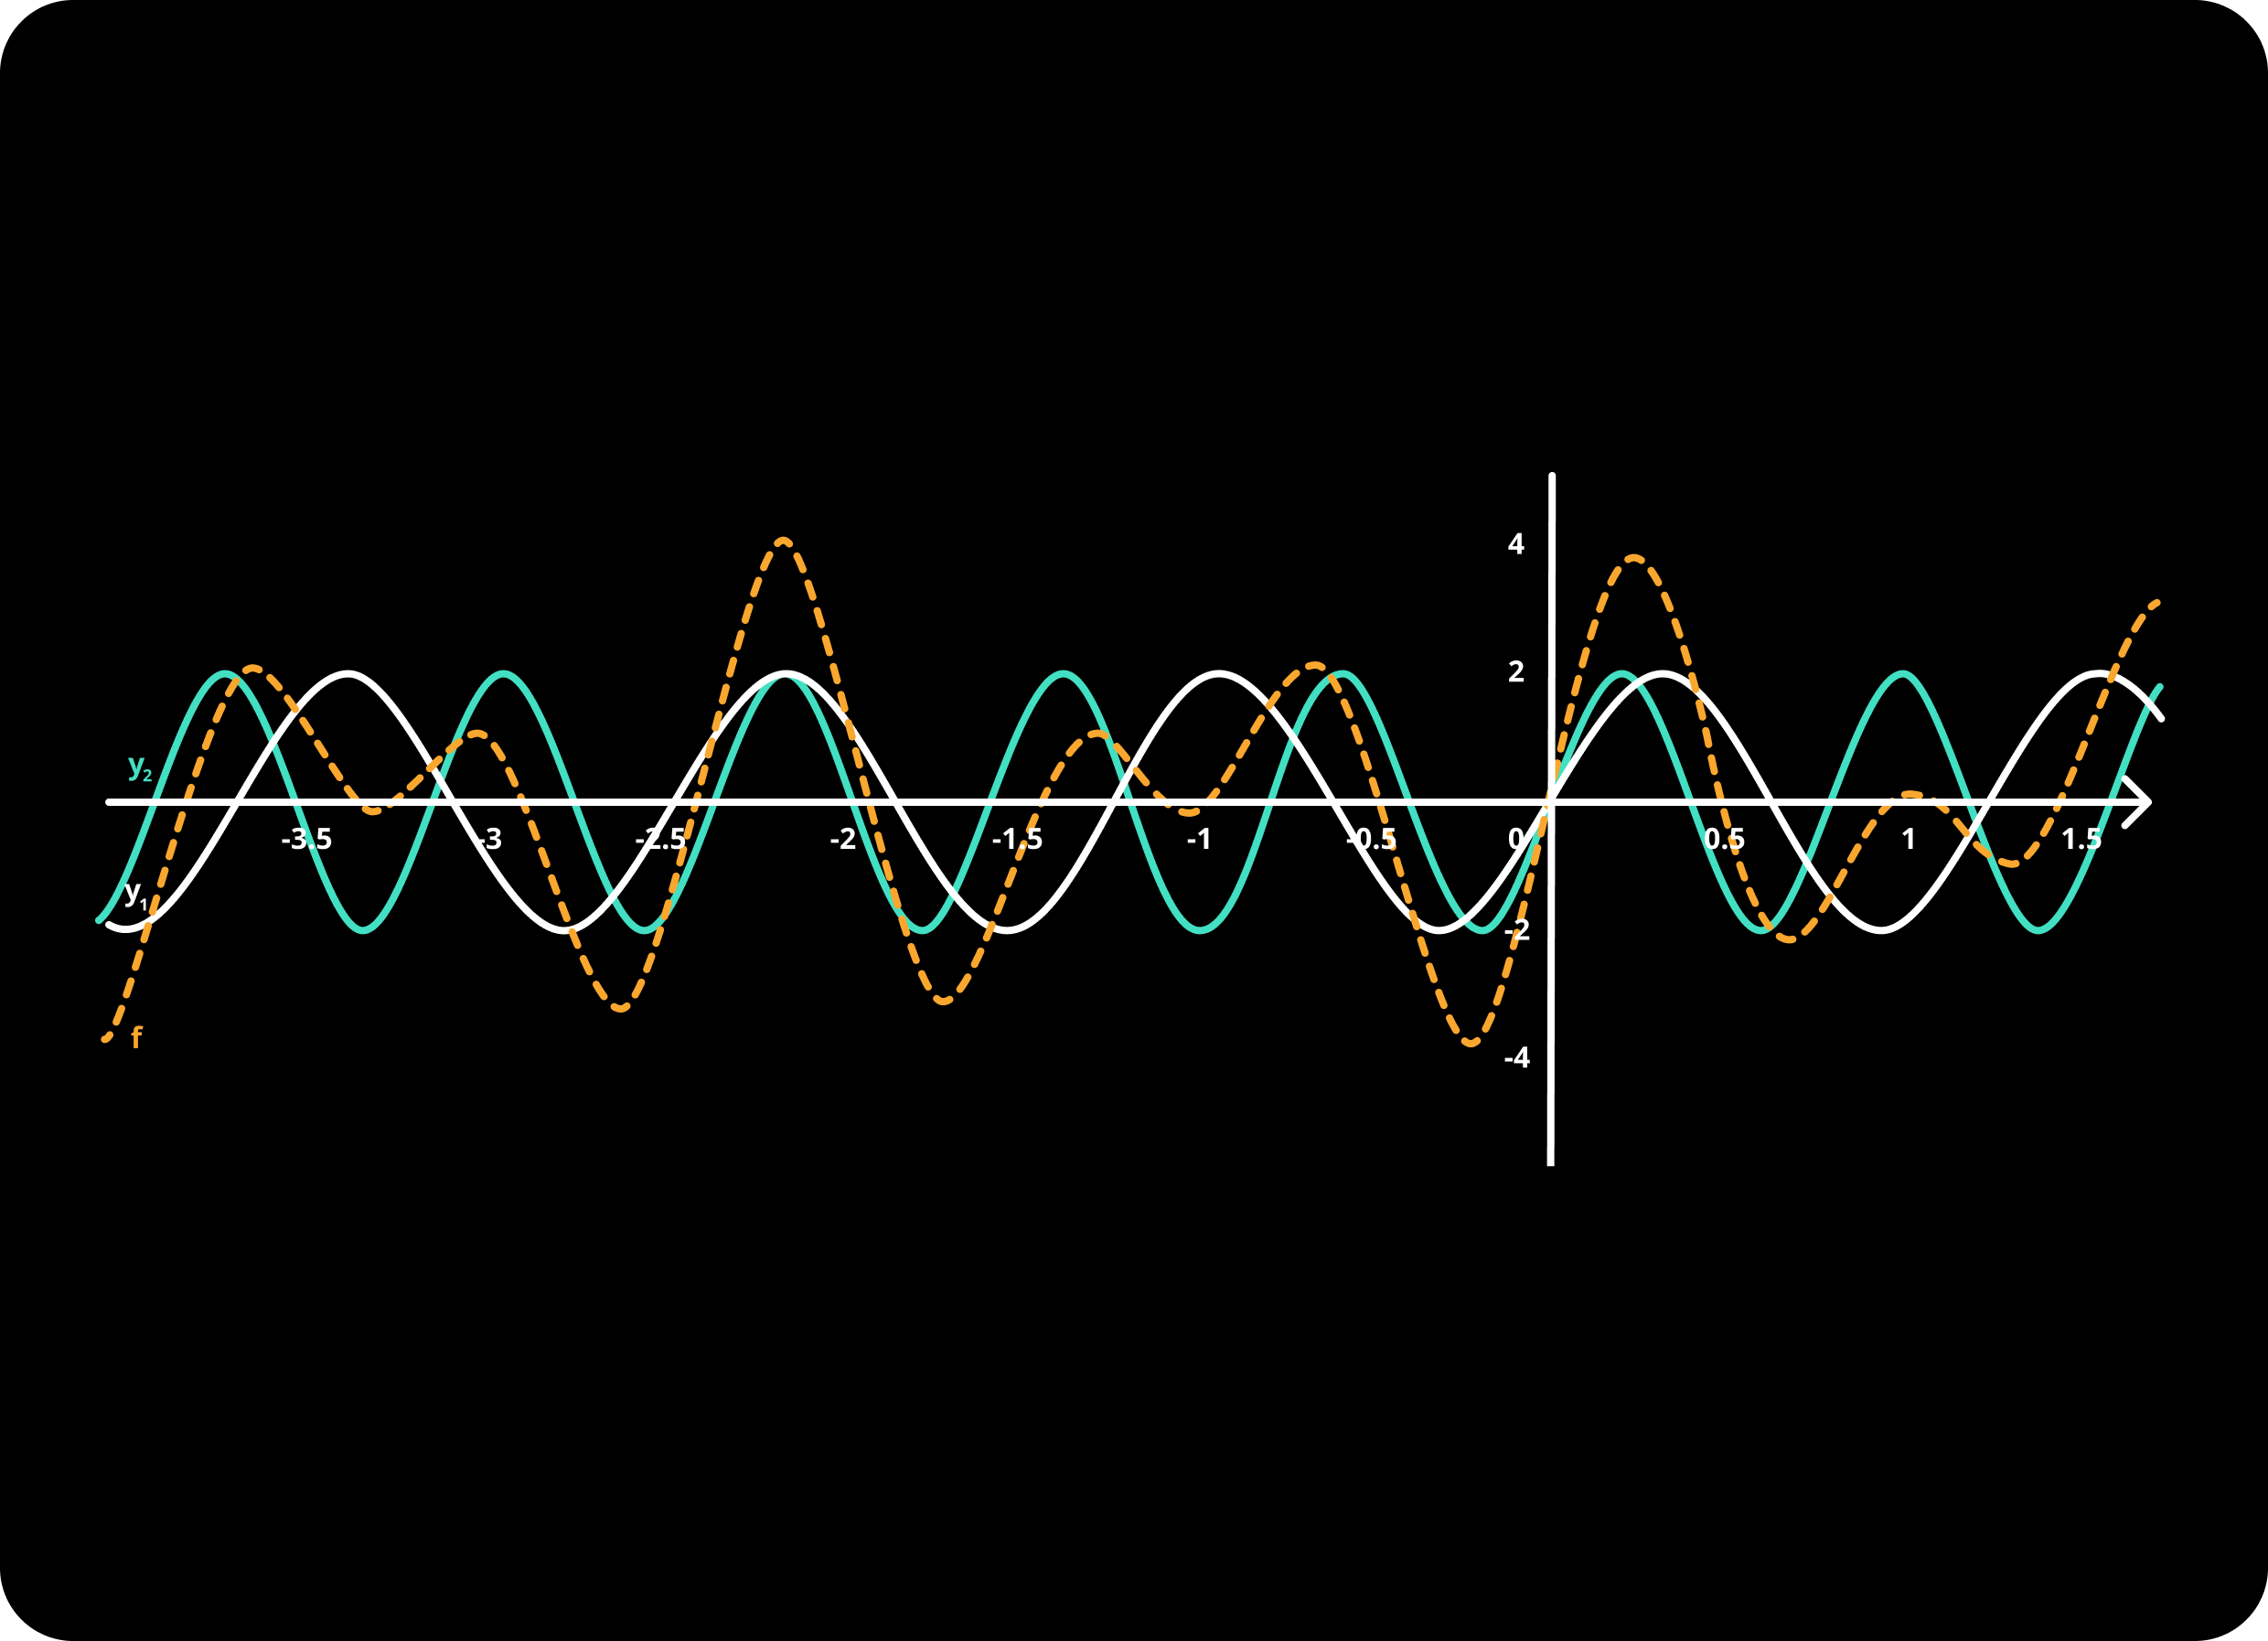
Recall our problem at hand: to be able to determine if a wave is part of some other wave.
To come up with a mathematical approach, we should be more clear in terms of our intuitions we have gained so far. Let’s name our waves:
Complex: addition of some waves, this can be as complex or simple as you willCandidate: a wave to be inspected to determine if it is a part of the complex wave (if it is one of the waves that constructed the complex wave).We can have a generalized claim now! To make it less abstract, I’m providing this familiar image, where:
White is CandidateCyan is ComplexAnd spoiler alert: in this image, the White wave (candidate) is indeed a part of the Cyan wave (complex). But remember, we don’t know this yet. Maybe candidate is not related to complex wave at all. We are trying to figure out if candidate is part of the complex.
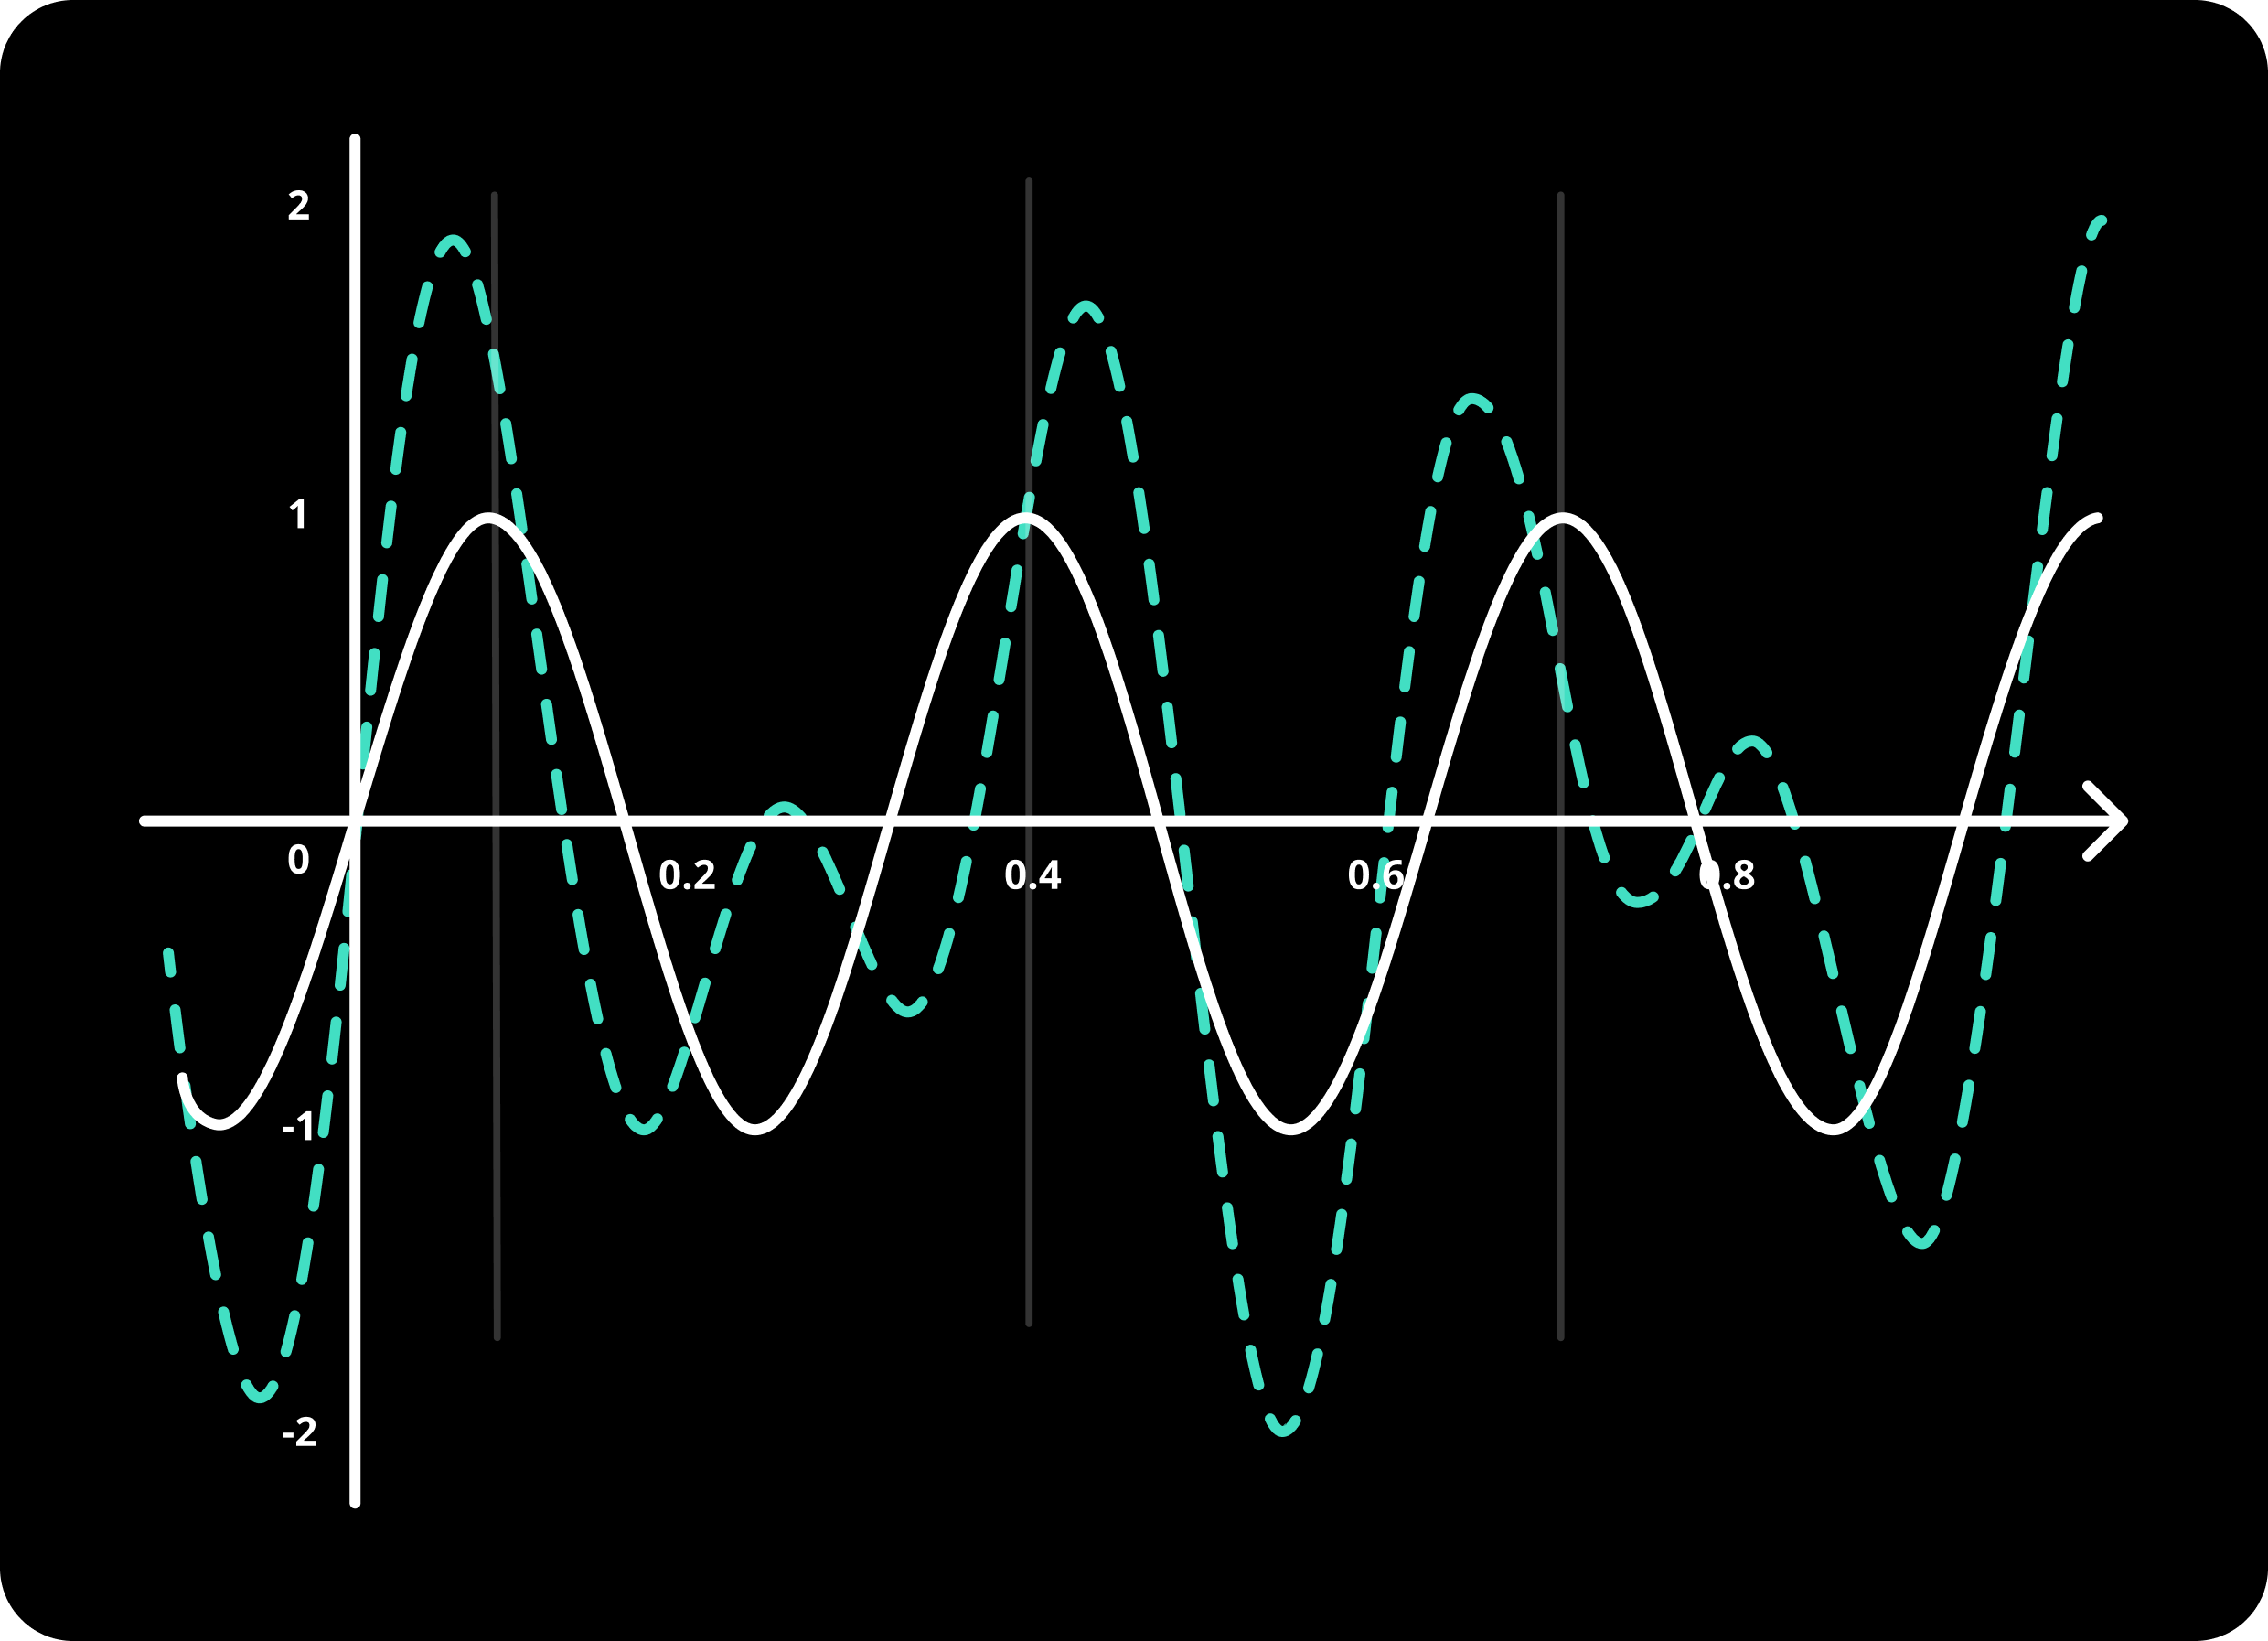
Recall:
I will refer to the below steps as our hypothesis throughout this post.
Below are the steps that will give a concrete answer of whether candidate wave is a part of the complex wave.
Label all the peak points of the candidate wave with big dots.
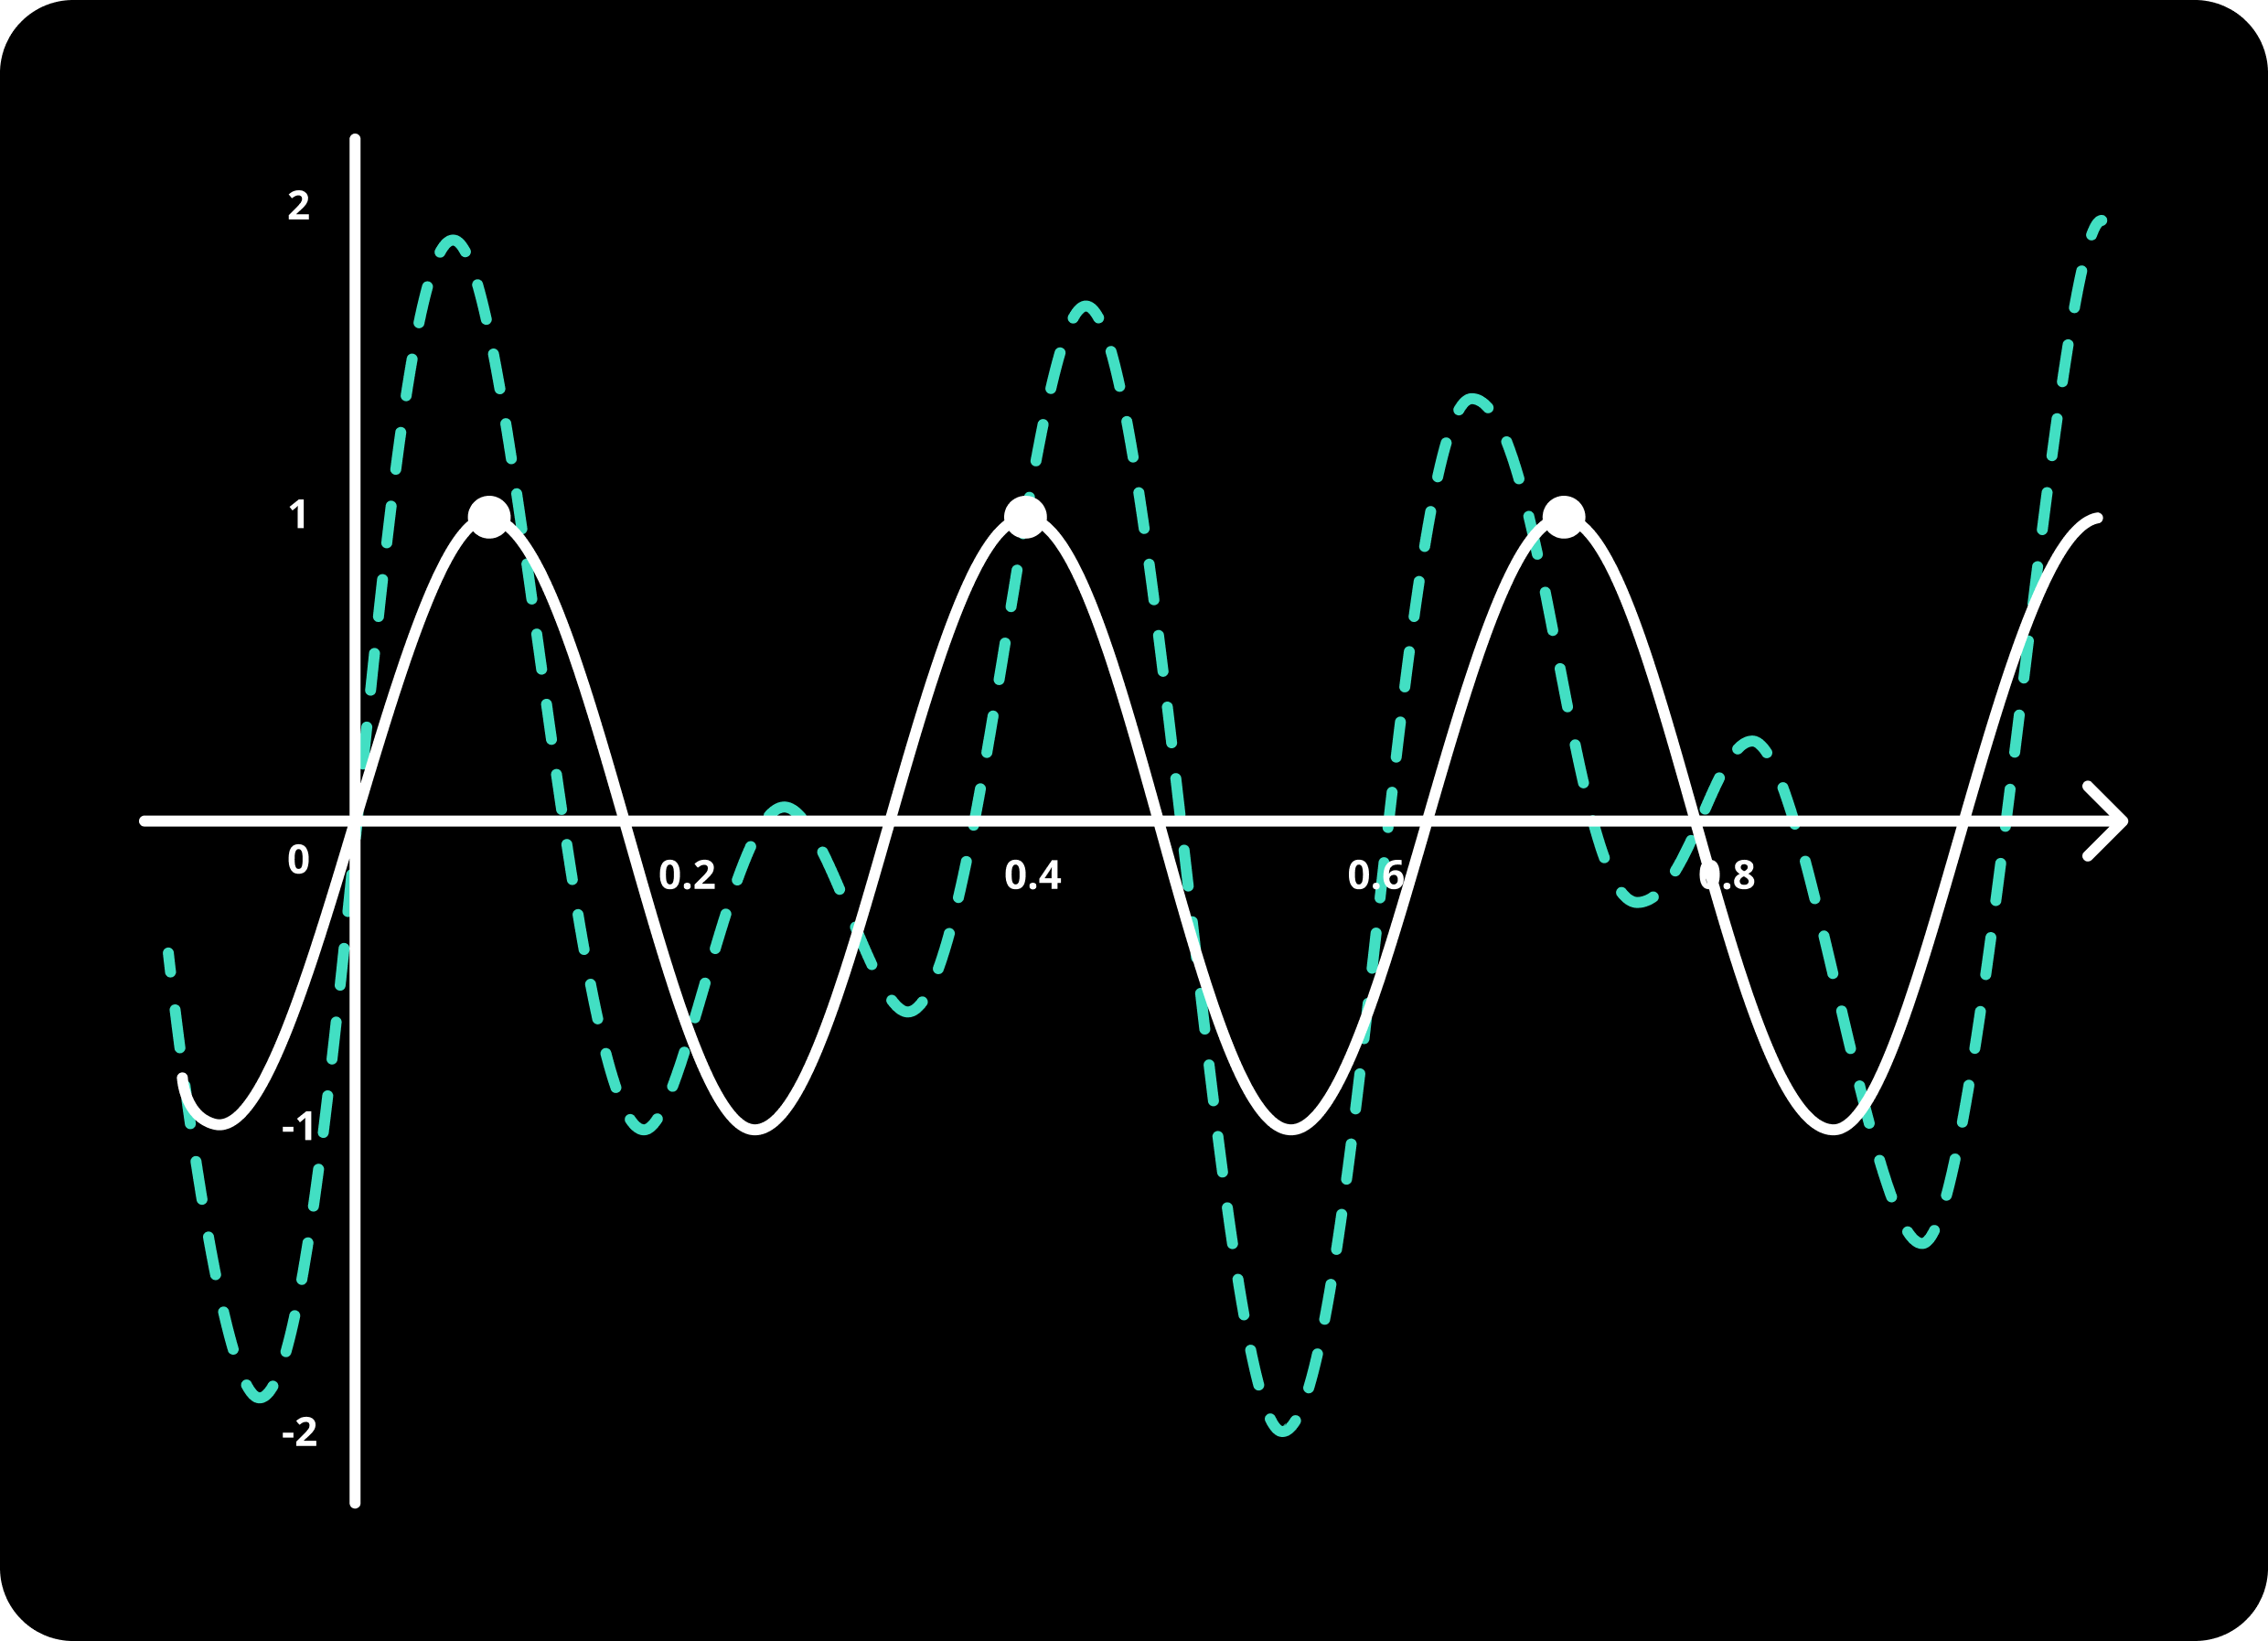
Draw a straight line from these labeled points and find which points of the Cyan wave this line intersects. Mark them with stars.
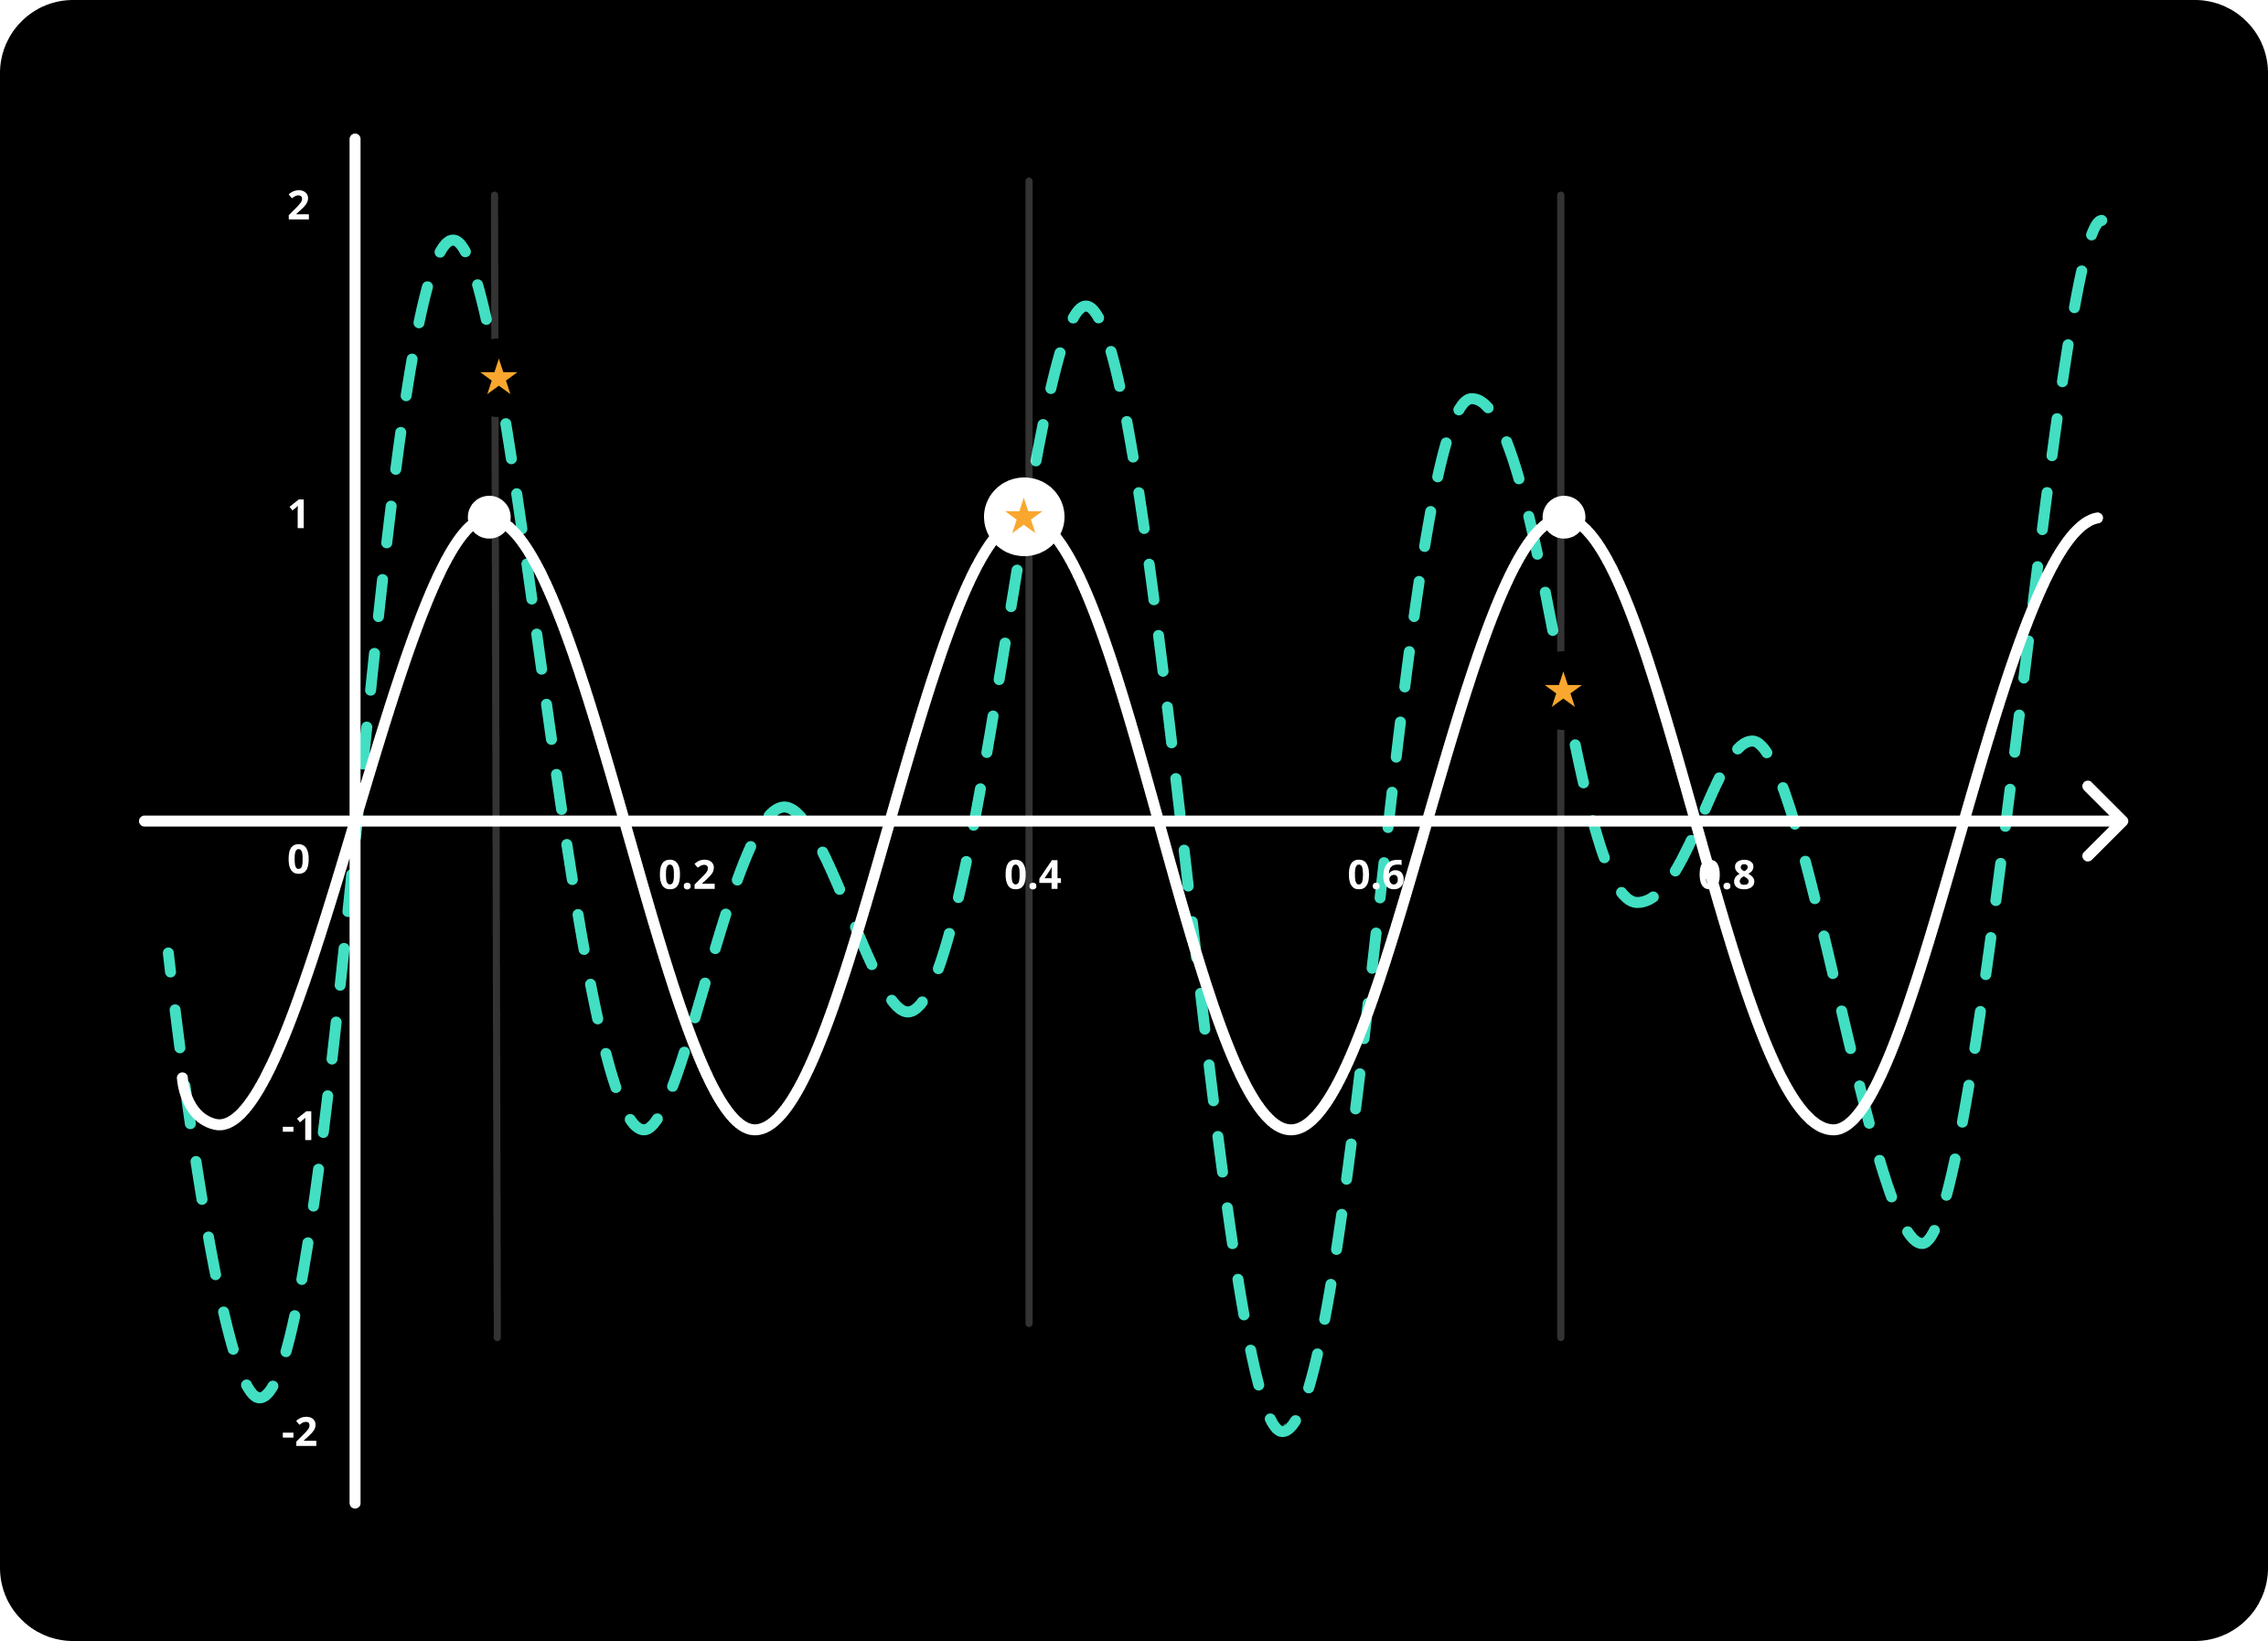
Now, ignore the Candidate wave, discard the labeled points for the Candidate wave (big dots). We don’t need them anymore. We only have the stars on the Complex wave at this point.
Sum the values of the Cyan wave’s labeled points (stars). To express it more mathematically: add Complex wave’s labeled point’s y-axis values (ordinates) together.
If the result is positive, the Candidate wave is indeed a part of the Complex wave!
This claim is always true if we have enough length of both waves.
Enough Length come from?Imagine two waves are not correlated (where Blue is not a component of Green).
Let’s be more concrete, for example:
Blue has a frequency of 999Green has a frequency of 1000In your mind, start both waves at the same time, and their amplitude (size) will be the same as well. Should be something like this if you have a good imagination:

In each 1000 units (regarding the x-axis), the peak of the Blue will be 1 off compared to the Green.
Now remember our generalized math formula (labeling the purple wave according to the blue wave’s peaks and adding these points y-values together).
So if you try to add the y-values of the Green together, for the points that Blue has a peak, it will go like this:
1000 + 999 + 998 + … + 2 + 1 + 0 + (-1) + (-2) + … + (-998) + (-999) + (-1000)
The above image was (1st bullet-point) showing the positive part of that equation. Now, let’s see the negative part:
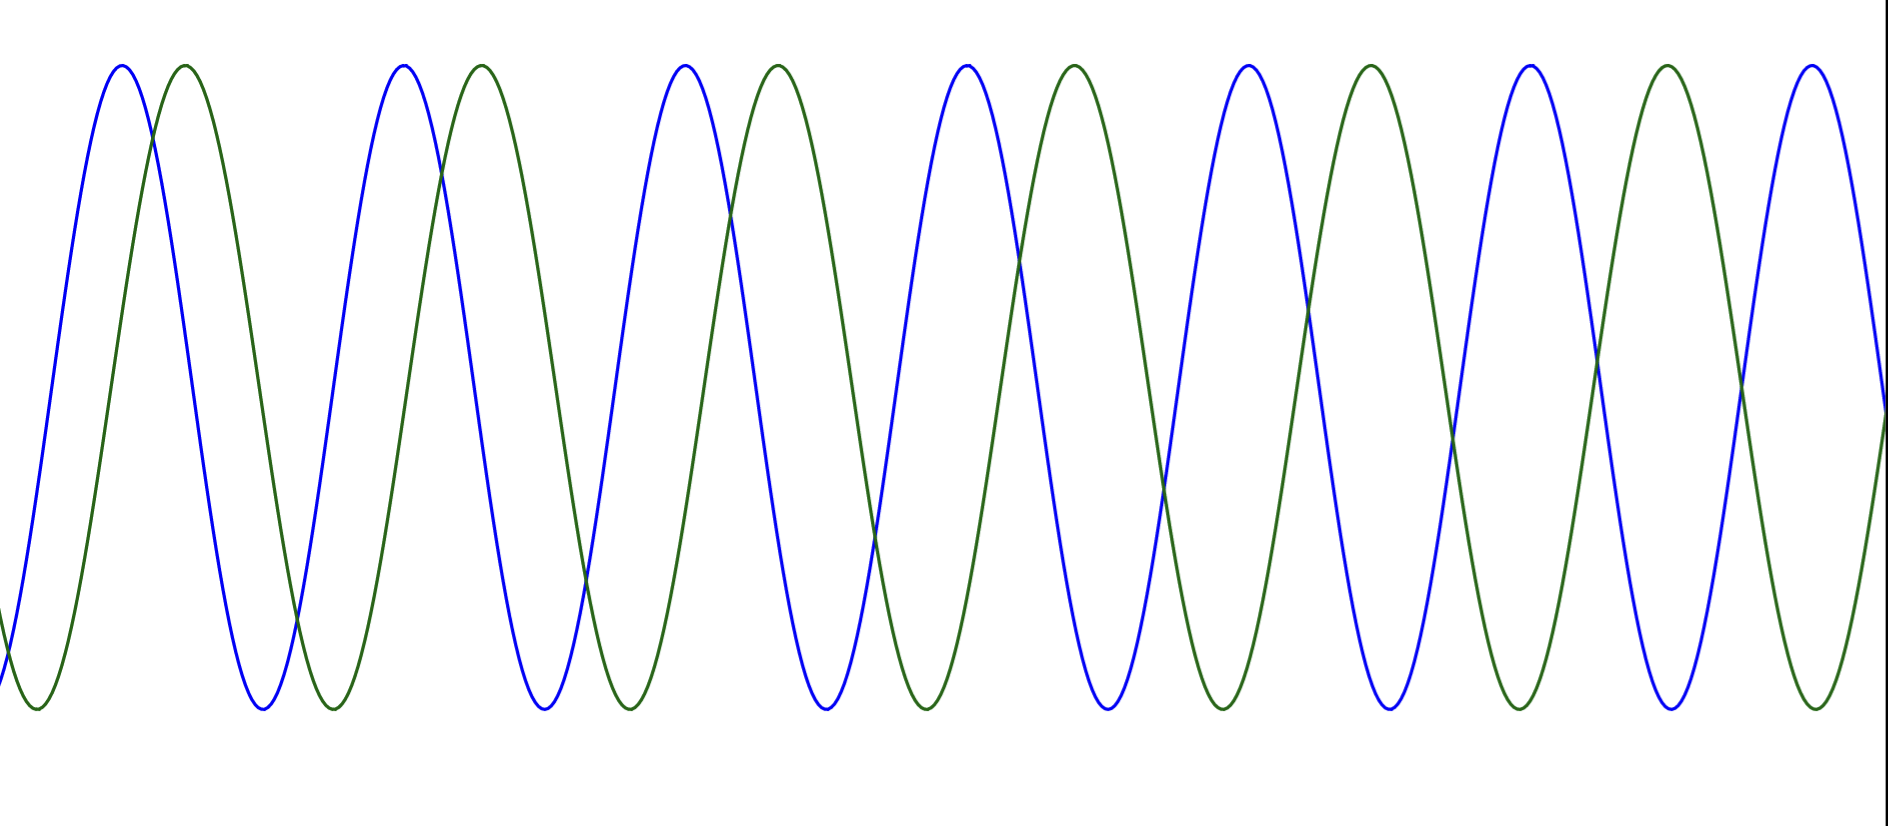
I lied, the numbers won’t exactly be those (999, 998, etc.), since we are dealing with sine functions, not with straight lines. But let’s not worry about the details. The important part here is: the values will be symmetrical and will cancel each other out in the end.
As a result, you got 0 if you sum these values. Because these two very similar looking waves (1000 and 999) are not components of each other. They are different waves.
If we hadn’t done this operation for enough points (say, we’ve performed this only for the first 5 points), then our sum wouldn’t be 0, it would be something positive. That means our waves should be long enough for our claim to work.
A good candidate would be using the LCM (least common multiple) for determining a length. However, it may not be the most optimal approach. I don’t want to dive into that, since we will be switching to a new approach, and I believe pondering on how long is enough will not be cost-efficient.
We will be abandoning this approach I’ve been mentioning so far because it won’t be practical in real-life.
In real life, we don’t know the frequency of the Complex wave. In fact, this is one of the reasons we are applying Fourier Transform to our wave, to find out the frequencies…
Finding the frequency of a wave is hard, since: imagine you have hundreds or maybe thousands of discrete data points of a complex wave (that is how real life works, you get to have discrete points, not a continuous data).
Complex wave. And the data available for us about the Complex wave may not have enough points…beginning of the wave to the ending of the wave. How to identify a complex wave’s beginning, or frequency, or ending?
Not an easy one for sure.I know, this whole thing… It was not easy to read, understand, and digest. But, don’t worry! Although we will not use it in real life, it still gave us a very extensive understanding of the waves.

I believe the example with 2 waves (one of them has the frequency 1000, the other one has 999) should convince us on:
0.This is a solid step. Now, we can explain the logic behind our hypothesis and why it works.
Say, we have a Complex wave:
complex wave can be expressed as the summation of basic sine waves.complex = A + B + C, where A, B, and C are components of this complex wave, and thus, they are some basic sine waves.A+B and C, where A+B is another complex wave, and C is the candidate wave.A+B and C are not parts of each other (unrelated), the result will be 0.C to A+B, you are effectively making the wave A+B more peaky, where C is peaky. This is what adding waves does, right?A+B+C should be somewhat peaky at points where C is peaky.A+B+C where C has peaks and trying to see if the answer is positive.There isn’t any math behind the choice for peak points. In fact, any periodic points (that have an equal distance between them) would do.
A retrospection: what we were doing is evaluating the complex wave at the points from the candidate wave. I chose the peak points because:
We could as well have chosen the dip points or the points where our candidate wave’s y-axis was 0. The intuition is the same.
I’ll emphasize the gist of it again: We are evaluating the
complexwave at some periodic points from thecandidatewave.
This should make sense since this basically means:
candidate wave).complex wave turns out to be in correlation with the candidate wave (positive sum for the peak points).The intuition behind the Fourier transform is basically that! For different waves, if the same inputs (x-axis values) are generating a correlated output (y-values that share the same sign) → it means these different waves are correlated as well. This is the answer to the question: Why does the Fourier Transform work for decomposing the waves?